There are lies, damned lies, and statistics: @BBCWorld #GenoaBridge edition. This chart should be shown in an introductory course of statistics as example of how stats can be tweaked to say pretty much anything, and the opposite (h/t @italiadati Original data is from @OECD) 1/ 
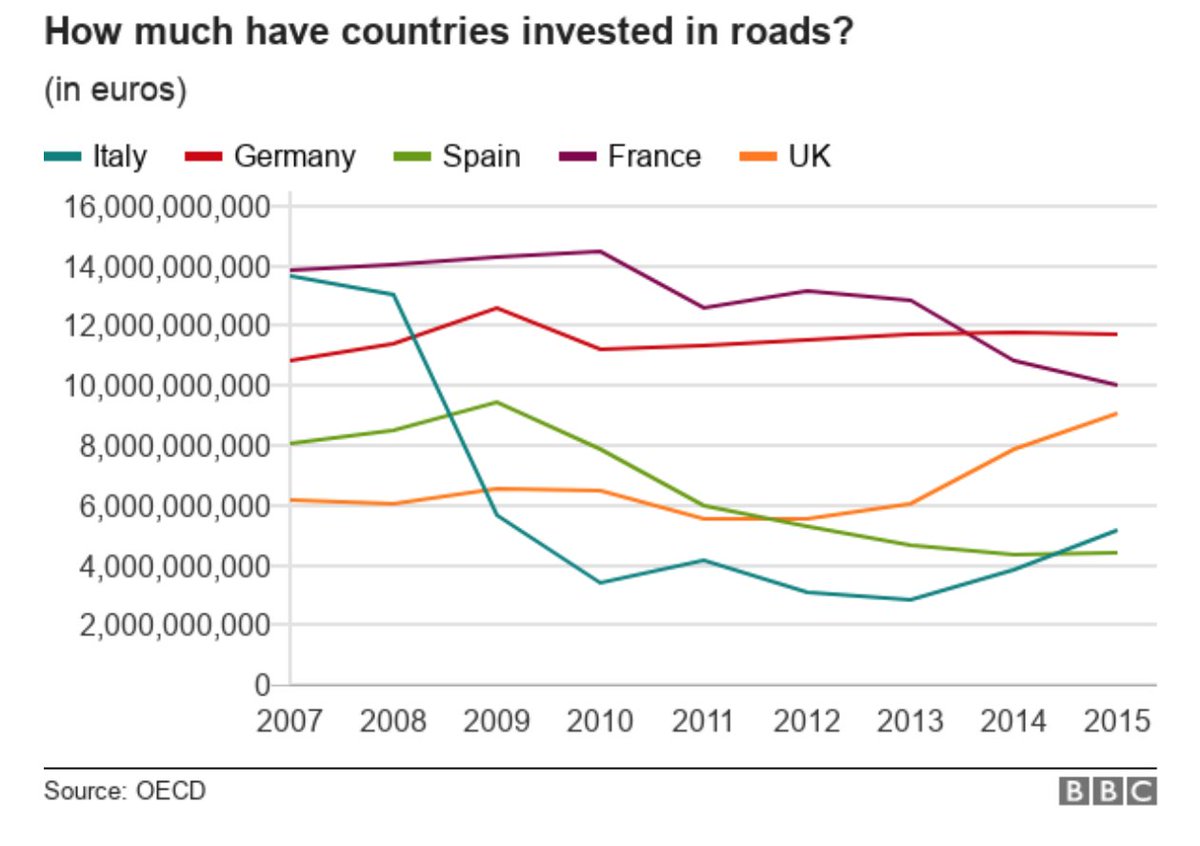
1st conceptual problem: the plotted variable is infrastructure investment in roads which, according to the data description "covers spending on NEW transport construction AND the improvement of the existing network." 2/
While interesting, it does not tell us whether the drop we see is due to (i) declining new investment or (ii) declining spending on existing network. Both things matter, but the relevance of them is different in the context of the #genoabridge story. 3/
2nd conceptual problem: the values are expressed in EUROS, which does not allow for a proper comparison because we are looking at countries that (i) have different inflation rates and (ii) in some cases even have an exchange rate because they have different currencies (UK) 4/
3rd (worst) conceptual problem: the data is actually available from 1995, and the cutoff point chosen by the BBC is not irrelevant because it leaves out a huge increase in investment in 2002-08, which is unique (see chart, which I also rescaled in %GDP to make it comparable) 5/

Quite a different picture, isn't it? Triggers different questions, too. The BBC pic has you wondering why investment declined so sharply in Italy after 2008. It plays into a certain political rhetoric that attributes "faults" to the crisis and subsequent economic policies. 6/
The full picture instead would probably have you wondering about what happened between 2002 and 2008 to explain the odd and unique pattern of road infrastructure investment in Italy. (I don't know the answer, insights from experts in infrastructure investment are welcome). 7/
Moving on to investment vs. maintenance, the @OECD also provides stats on expenditure for road maintenance, which "covers spending on preservation of the existing transport network. It also covers maintenance expenditure financed by public administrations." 8/
Here is the expenditure for investment vs. maintenance of roads in Italy (% GDP, 1995-2016). It is interesting because while both decline in 2007, maintenance expenditure then picks up again in 2011-14 (the "austerity period"). So another different angle into the question. 9/

Concluding this nerd outburst: stats are a powerful tool and can serve many "truths". If you're on the consuming side of charts, be your own fact checker, look at the data, and ask your own questions. If you are on the producing side, please don't do *THIS*! end/
p.s. some have pointed out that data in euros is not a problem, because we are comparing countries w similar inflation and stable exchange rate. That may hold for case in point, but not in general (think e.g. of long historical comparisons or adding emerging mkts to your sample).
Moreover, absolute euro numbers do not relate to the size of the economy, which may bias rankings (someone who spends "more" in absolute € may be spending "less" in % of its GDP). So I'd still normalise when looking cross-country (be it by GDP, by km of roads, you name it)
p.p.s. others rightly pointed out that we should rather delve deeper into the micro, to see how the money is actually used. I absolutely agree, although perhaps less easy to do from public data. I'd love to read such an analysis for Italy: if you run into one, pls point me to it.
My intention was to highlight issues with one apparently straightforward chart, to suggest we should be careful when reading stats, even when the interpretation may seem obvious. I'm glad a lot of people reacted and engaged with this nerd enterprise! Thank you and keep it up!
• • •
Missing some Tweet in this thread? You can try to
force a refresh