1/ Well, it's the first full week of the final month of the quarter. Know what that means? Time for my quarterly U.S. #Energy #Storage tweetstorm! As always, I'll be sharing highlights from WoodMackenzie P&R/ESA's report, the U.S. Energy Storage Monitor.
1a/ To be clear: WoodMackenzie Power & Renewables (P&R) is the new brand of the former GTM Research!
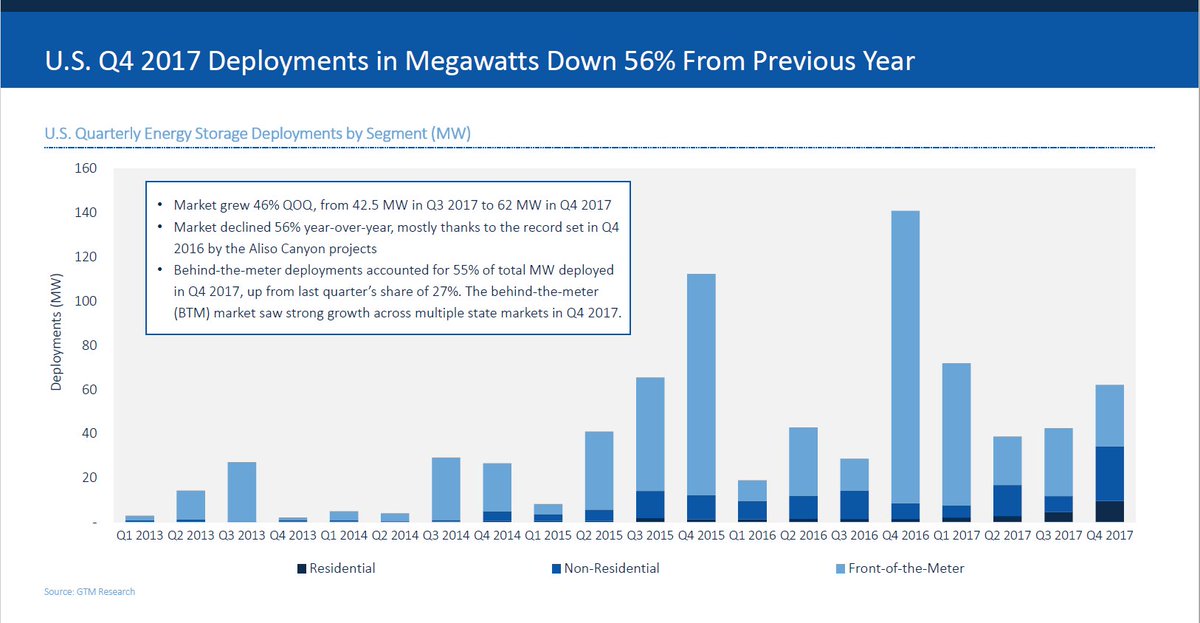
2/ Q2 2018 saw the U.S. market grow 42% QOQ to 61.8 MW! The behind-the-meter market accounted for 75% of MW deployed. 

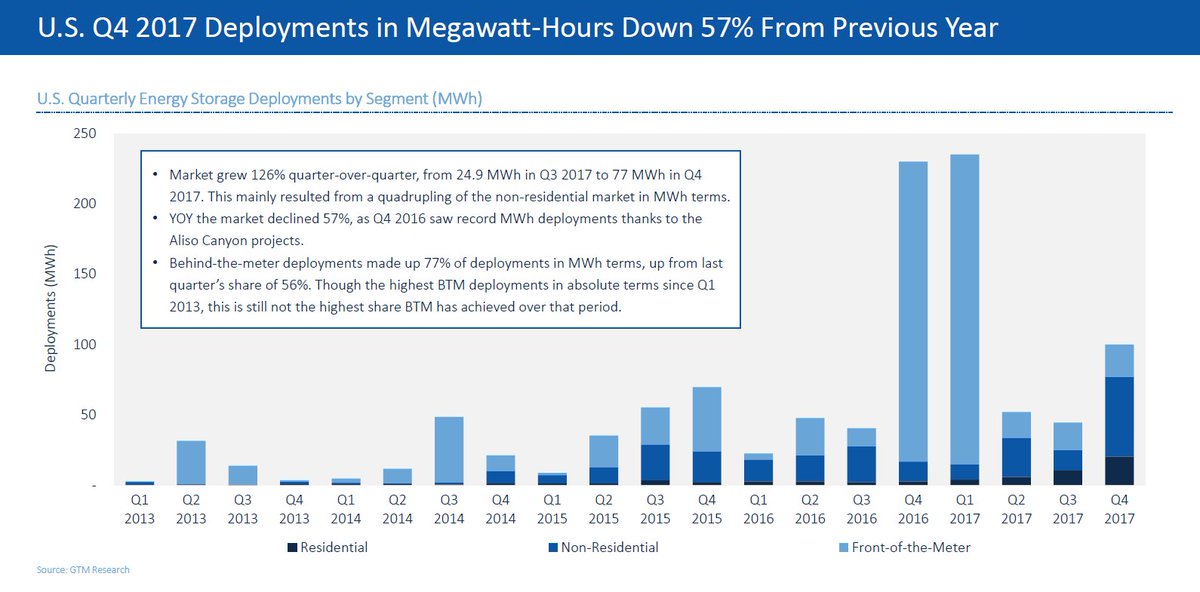
3/ In MWh terms, the market was up 3x YOY and 24% QOQ, reaching a grand total of 156.5 MWh. It's worth noting that we're seeing a continued trend toward longer duration systems for services such as capacity.

4/ It's worth noting that Q2 2018 was a record quarter for residential storage: more residential storage deployed in Q2 2018 than in all of 2017. Plus, more residential storage was deployed than FTM storage for the first time ever!
5/ Underlying the growth of residential storage: reduced NEM compensation, implementation of TOU rates by utilities, increased customer interest in backup and self-consumption, and a greater push from solar installers for storage products.
6/ However, we've also heard that residential installers are having trouble getting storage products in the quantities they need. This betrays a Li-ion battery supply constraint affecting all 3 segments. Thus, we expect H2 2018 to be comparable in size to H1 (normally H2 > H1)
7/ Though this won't be a long-term problem: our tracking of battery manufacturing shows massive amounts of capacity: global Li-ion cell manufacturing will reach 350 GWh produced annually by 2020 (today we're around 120 GWh)
8/ California continues to rule the roost behind-the-meter, thanks to changing NEM rules, shifting rate tariffs, incentives, and customer demand. Hawaii is second for residential, thanks to NEM shifts and viability of self-consumption.

9/ On the front-of-the-meter side there was a slower quarter, but a fun fact is that every FTM storage system deployed this quarter was paired with #solar.
10/ FTM players are getting more excited about solar-plus-storage, and we're seeing aggressive solar-plus-storage procurements in places like Arizona, California, Colorado, and Nevada.
11/ I mentioned battery supply constraints earlier, as capacity is committed to already contracted projects. Specifically, it's led to a 9% uptick in Li-ion battery rack prices. Though, as I mentioned before, this is only a short-term challenge.

12/ And where is the market going? By 2023, we expect 3.9 GW of annual deployments, led by the FTM market. We'll see gains across all segments as market opportunities open, such as for grid services, and storage system prices decline.

13/ Of course, the full report has tons of additional meat on storage policy, vendor activities, VC investments, M&A, a deep dive into the NY storage market, and more. Subscribers can access the full report here: greentechmedia.com/research/repor…
14/ You can also use the link from the previous tweet to download a copy of the Executive Summary.
15/ All that said, Q2 2018 was another exciting quarter for U.S. storage! If you read the full report, we look forward to your feedback.
• • •
Missing some Tweet in this thread? You can try to
force a refresh