Zafar Shaikh Profile picture
Oct 5, 2018 7 tweets 3 min read Twitter logo Read on Twitter
Pulling Out Two Slides At #DECMA Presentation In March This Year Detailing #Cycles Of Stock Market and Where We Are At Current Juncture! The #BennerFibonacci Time Cycles Point That Major Stock Market Cycles Happen With 8-10 Year Difference Between Consecutive Tops & Bottom (1/n)
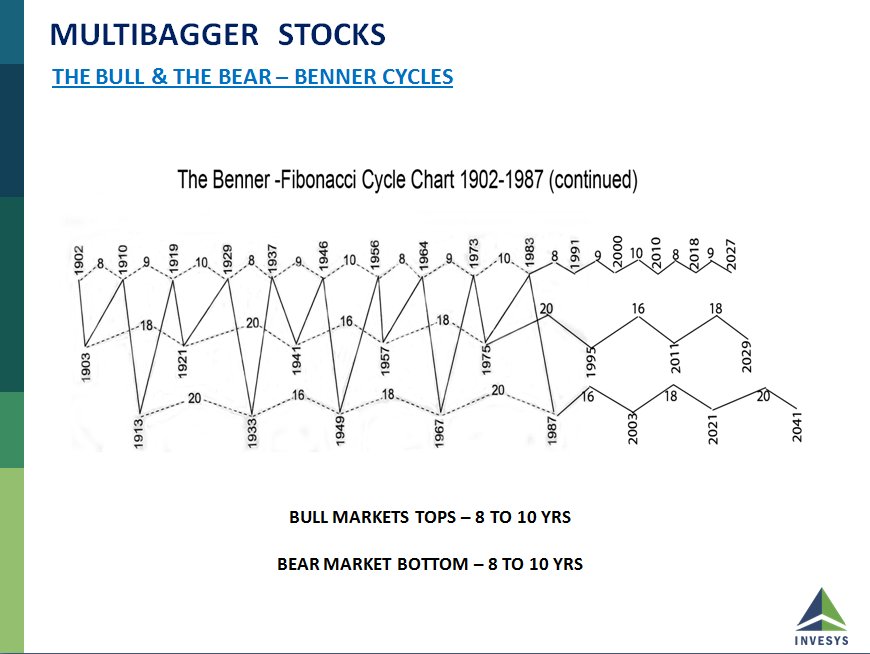
We Had Major Market Tops In SENSEX at 1992, Followed By 2000 (8Yr), Followed By 2008(8Yr).. Now We are in 2018 (10 yrs). There Are Intermediate Corrections Also In-Between. The Difference -Correction After Benner Time Cycle is Complete Are Severe With Index Dropping 40-50% (2/n)
Had This Hypothesis Since Last Year That Sometime We Are Going To Face This TimeCycle in 2018. Jan-Feb Correction Looked Like Beginning, But That Was Not To Be,. Now We Have Some Kind Of Confirmation Of Beginning Of Correction On Monthly Charts. We Are In Initial Stage (3/n)
The First Sign of Monthly Correction Is Index Closing Below 10SMA On Monthly OverBought Charts. The Month Is Yet To Close, But It's an Early Indication. These Correction On Monthly Run For 12 to 18 Months, So We Can Expect Current Correction to Last Till 2019 End-Early 2020 (4/n)
However, It's Not One Way Street. There Are Sharp PullBacks In Between, Lasting 3-4 Months. The Maximum Damage Is Inflicted In last 3-6 Months Of Correction. However, We Have Already Seen Much Damage In Smallcap Space. Now Last Part. Where Does These Corrections End? (5/n)
Well, Looking At Data On All World Indices Bear Market & Our Own Market, These Corrections Run Till 10 year Average Price On Index. Converting That To Quarterly Charts, It Comes To 40 Quarter SMA. Below SENSEX Chart For Same. 2000-2001 & 2008-09 Correction Ran Till Those Levels-6
Currently , That Level on Sensex is 23400 & 7000 On Nifty. As Time Progress, These SMA Rise. Considering That, I am Expecting Correction To Run Till Nifty 7000-8000 & Sensex 25000-30000. Now This Is Hypothesis & May Turn Wrong Too . Accept or Reject At Your Discretion (7/7)

• • •

Missing some Tweet in this thread? You can try to force a refresh
 

Keep Current with Zafar Shaikh

Zafar Shaikh Profile picture

Stay in touch and get notified when new unrolls are available from this author!

Read all threads

This Thread may be Removed Anytime!

PDF

Twitter may remove this content at anytime! Save it as PDF for later use!

Try unrolling a thread yourself!

how to unroll video
  1. Follow @ThreadReaderApp to mention us!

  2. From a Twitter thread mention us with a keyword "unroll"
@threadreaderapp unroll

Practice here first or read more on our help page!

More from @InvesysCapital

Sep 22, 2018
#New Traders, Understand #Mathematics Of #Profit In Market Before You Put Hard #Earned Money On Risk.

Expectancy = Success Rate x Reward Risk Ratio

Lets Talk About Expectancy Of Short Term Directional Trading System.

Read On (1/n)
Success Rate = No Of Profitable Tades/ No Of Loss Making Trades

Reward Risk Ratio = Average Profit Per Trade / Average Loss Per Trade

If Success Rate is 0.5 and Reward Risk 2, Then

Expectancy = 2 x 0.5 =1

For Making Profit, Expectancy Should Be Positive Number (2/n)
To Calculate Expectancy, You Need Defined System With Rules To Get Success Rate and Reward Risk. If You Have No System To Take Decisions, You Are Hanging In Thin Air and Will Never No Whether You Will Keep Making Or Loosing Money In Future (3/n)
Read 12 tweets

Did Thread Reader help you today?

Support us! We are indie developers!


This site is made by just two indie developers on a laptop doing marketing, support and development! Read more about the story.

Become a Premium Member ($3/month or $30/year) and get exclusive features!

Become Premium

Don't want to be a Premium member but still want to support us?

Make a small donation by buying us coffee ($5) or help with server cost ($10)

Donate via Paypal

Or Donate anonymously using crypto!

Ethereum

0xfe58350B80634f60Fa6Dc149a72b4DFbc17D341E copy

Bitcoin

3ATGMxNzCUFzxpMCHL5sWSt4DVtS8UqXpi copy

Thank you for your support!

Follow Us on Twitter!

:(