#Tweetorial on #Diagnostics and #Screening interpretation.
An otherwise healthy 40 year old woman comes to you after reading on the internet about a terrible disease that one in a thousand women get, and a highly accurate test that can save her life.
An otherwise healthy 40 year old woman comes to you after reading on the internet about a terrible disease that one in a thousand women get, and a highly accurate test that can save her life.
The test is over 99% accurate in people with the disease. For those without disease, the test is only wrong 5% of the time.
You order this test and it comes back positive. The woman anxiously asks you, do I have the disease? What is the chance this woman has the disease?
You order this test and it comes back positive. The woman anxiously asks you, do I have the disease? What is the chance this woman has the disease?
Assuming they weren't immediately fooled by the "test is only wrong 5 % of the time," most I've asked correctly recognize the stats provided are Sensitivity = 99% and Specificity = 95%, and that the objective is to determine the Positive Predictive Value.
They dutifully fill-in a 2x2 contingency table as such, and calculate the positive predictive value = PPV = Post-Test Probability = P(D+|T+) = 99/(99+5) ~ 95%. 

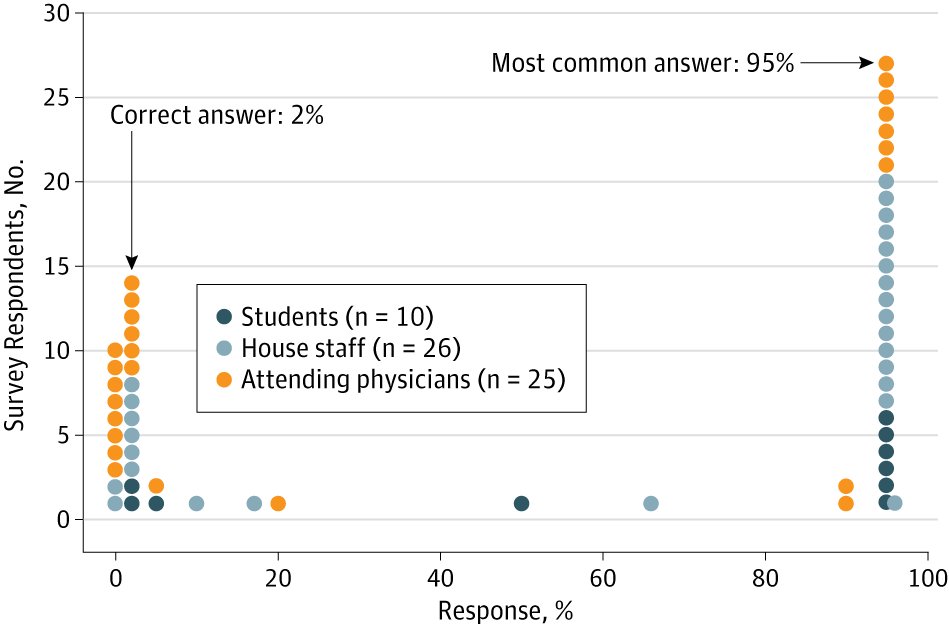
Indeed, "Medicine's Uncomfortable Relationship with Math" reconfirms that the vast majority of people (including med students, residents, and attendings) believe the answer is ~95%.
jamanetwork.com/journals/jamai…
jamanetwork.com/journals/jamai…
Some are self-aware that something's not right, and that somehow prevalence (pre-test probability = 1/1000 if you noted in the opening stem) has something to do with it, but are not sure how to use it. Maybe 95% x 1/1000 = 0.1%?
Many methods, but I find the 2x2 table convenient to work through these problems. In addition to internal ratios, the main trick is ensuring that the rows and columns add up properly (1 Disease+ for every 999 Disease- to reflect baseline prevalence).

In this case, that means the probability of the woman having the disease = 0.99/(0.99+50) = 1.9%. WAY less than the 95% chance of breast cancer you made this woman panic about a minute ago. (If you hadn't guessed, the example is about mammogram screening.)

#Diagnostics #Screening #Tweetorial follow-up on #AppleWatch to screen for #AFib. Copied from a company website: "Atrial fibrillation is a silent killer. The heart arrhythmia causes more life-threatening strokes than any other chronic condition, and will affect 1 in 4 of us."
"But the sad fact is that atrial fibrillation often goes unnoticed: It is estimated that 40% of those who experience the heart condition are completely unaware of it."
Using #AppleWatch technology and #DeepLearning #AI #ML, a device algorithm can reportedly detect atrial fibrillation with high accuracy (c-statistic 93%).
If a 50 year old asymptomatic tech CEO comes into your office demanding additional testing because his watch just told him he has #Afib. What would you do?
Simpler question first. What are the chances that this man has atrial fibrillation?
"I don't know" is probably the best answer, because the information above is insufficient. "1 in 4" likely refers to total lifetime incidence, even if that means you had Afib for 1 day when you were 90 years old.
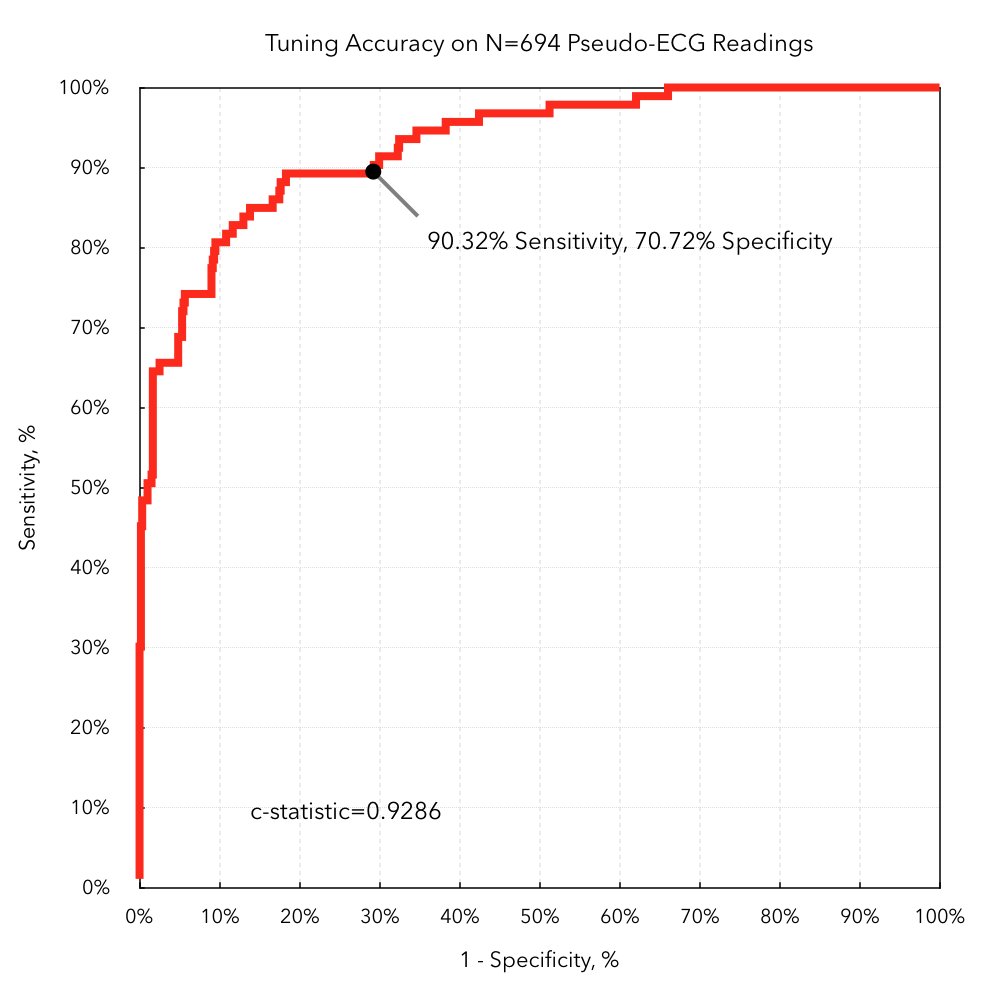
C-statistic = AUROC = Area under Receiver Operating Characteristic is commonly used to judge the accuracy of predictive/diagnostic algorithms, but is similar to sensitivity/sensitivity in not considering pre-test probability. jamanetwork.com/journals/jamai…
AUROC specifically avoids defining a particular sensitivity/specificity cutoff, instead reporting the tradeoff across a range of values. To do an actual decision calculation though, we'll need to pick a threshold. blog.cardiogr.am/detecting-atri…
With the above graphs, you should have enough to calculate an answer. I'll be back later with examples, including interpretation of likelihood ratios that are arguably more useful than sensitivity/specificity (especially if you want to combine multiple test results).
In the meantime, read @drjohnm's editorial for some good perspective on the challenges and dangers of screening asymptomatic people for disease. jamanetwork.com/article.aspx?d…
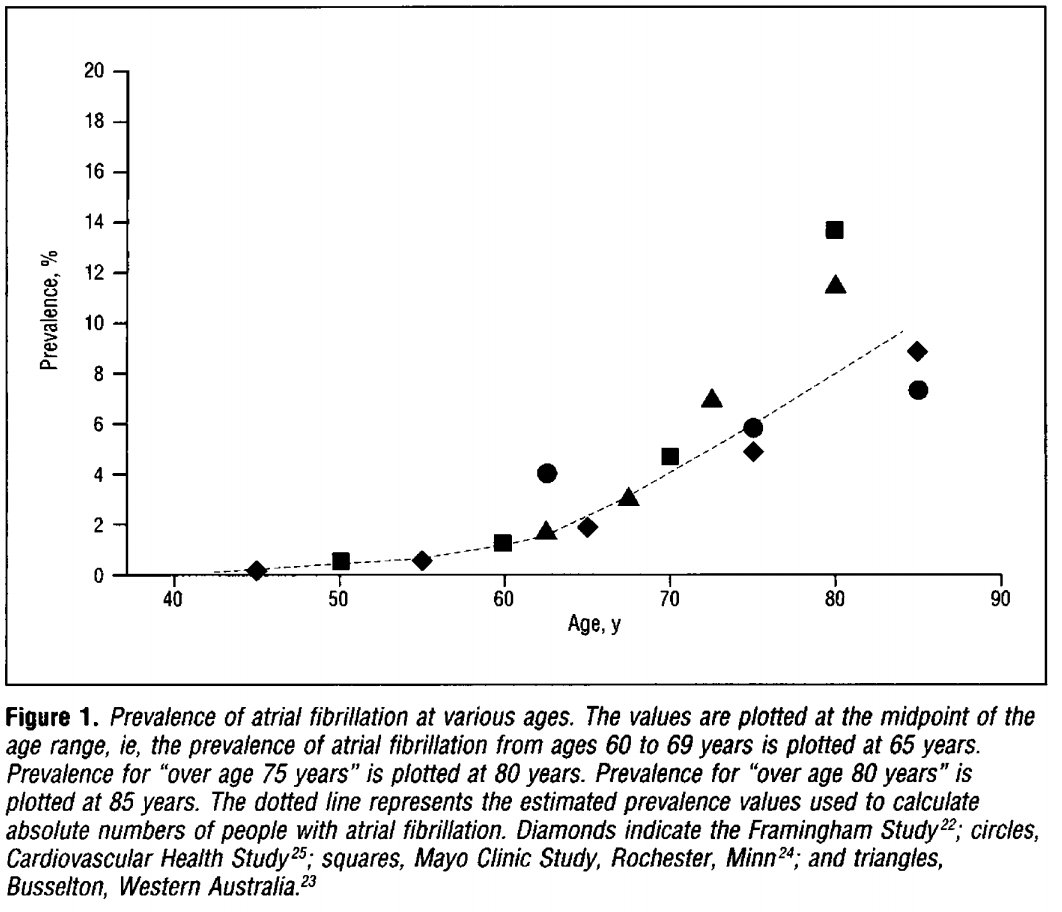
More misdirection. Readers may fear they have 40% chance of Afib even if asymptomatic. I.e., P(Afib|Asymptomatic) = 40%. Not even a little bit close. The prior statement means P(Asymptomatic|Afib) = 40%. See age-based prevalence charts to estimate P(Afib|Asymptomatic).

I also don't like AUROC being described as "accuracy." Not that total accuracy is any better. Again, misleads people when they hear "93% accurate," so if I get a positive result, then 93% certain I have the disease! 😱 Ugh. Wrong.
Complete coincidence. Timely article addressing similar concepts on the limited intuition and difficulty people have with interpreting diagnostic tests. washingtonpost.com/news/postevery…
• • •
Missing some Tweet in this thread? You can try to
force a refresh