Risk Ratio, Odds Ratio, Hazard Ratio
========================
2nd and final part of the tweetorial, from ORBITA-HQ!
Fun, easy and informative [*]
#MedEd #FOAMed #cardiology #cardiotwitter
[*] Results may vary and are not guaranteed. See small print.
========================
2nd and final part of the tweetorial, from ORBITA-HQ!
Fun, easy and informative [*]
#MedEd #FOAMed #cardiology #cardiotwitter
[*] Results may vary and are not guaranteed. See small print.
Not all fears are alike.
* Some fears are one-and-done:
I get a cold which progresses to pneumonia. Will I die, or recover?
* Other things hang over us for much longer, perhaps all your life.
Will you get hit by a bus?
Get a heart attack?
There's no "sell by" date on the fear.
* Some fears are one-and-done:
I get a cold which progresses to pneumonia. Will I die, or recover?
* Other things hang over us for much longer, perhaps all your life.
Will you get hit by a bus?
Get a heart attack?
There's no "sell by" date on the fear.
Practice Qs
You are walking through Hyde park, minding your own business.
Hardly causing any trouble at all.
Perhaps the odd humorous tweet.
You get a Direct Message:
"Enough of ur abuse!
You will be hearing form my agent shortly.
kthxbai
AJ Kirtane"
You see the agent:
You are walking through Hyde park, minding your own business.
Hardly causing any trouble at all.
Perhaps the odd humorous tweet.
You get a Direct Message:
"Enough of ur abuse!
You will be hearing form my agent shortly.
kthxbai
AJ Kirtane"
You see the agent:
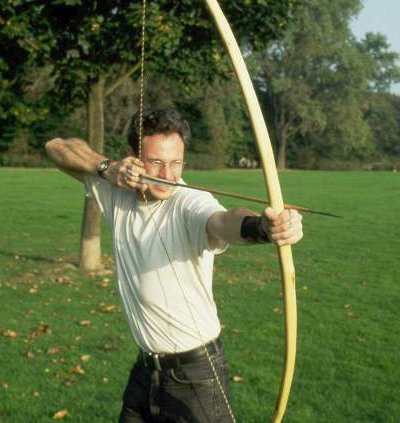
Shortly, the "swoosh" of an arrow pierces the afternoon quiet, and as you throw yourself into the shrubbery, you notice the archer has no spare arrows.
There is a single arrow.
If it misses, can that particular shot suddenly kill you later that day, or tomorrow?
There is a single arrow.
If it misses, can that particular shot suddenly kill you later that day, or tomorrow?
Fortunately, you escape.
But you do have a bit of a sweet tooth, and a big tummy.
Your doctor calculates your 10-year CV risk as "15% over 10 years".
You are not very good with numbers, but this doesn't sound good to you.
But you do have a bit of a sweet tooth, and a big tummy.
Your doctor calculates your 10-year CV risk as "15% over 10 years".
You are not very good with numbers, but this doesn't sound good to you.
"Cheer up," says your friend Maricris Tuason.
"Per year, it's only 1.5%! You are 98.5% infarct free this year!"
This slowly sinks in as better news.
"Per year, it's only 1.5%! You are 98.5% infarct free this year!"
This slowly sinks in as better news.
"Per month, 0.1%," she continues.
"Per day, 0.004%. So stop worrying."
"Per day, 0.004%. So stop worrying."
Is a probability of survival of 99.996% good?
For things that "depend for how long", there is no point quoting a risk or an odds, on their own. You MUST also quote how long this is for.
Let's summarise so far.
Let's summarise so far.
When you have a one-and-done event, such as a pneumonia where you die or not, a single bullet which kills you or not, then you
DO THE EXPERIMENT and
COUNT THE BODIES
The only thing that matters is how many people died (or whatever).
DO THE EXPERIMENT and
COUNT THE BODIES
The only thing that matters is how many people died (or whatever).
The mathematically best thing to do, to see if a treatment makes one-and-done events SAFER, is the ODDS RATIO or RISK RATIO (also called relative risk)
ODDS RATIO
is mathematically best. Frank Harrell has no doubt got a few chapters in his "Baffling Book of foRmulas" [BBR] about why Odds Ratio is preferable.
In short, ODDS ratio lets us see that 90% mortality is much better than 99%, even though the RISK ratio is almost 1.
is mathematically best. Frank Harrell has no doubt got a few chapters in his "Baffling Book of foRmulas" [BBR] about why Odds Ratio is preferable.
In short, ODDS ratio lets us see that 90% mortality is much better than 99%, even though the RISK ratio is almost 1.
RISK RATIO
is easiest for general people to understand.
For probabilities that are much closer to 0 than 1, odds ratio and risk ratio are almost the same. So we can almost interchange them.
But both are for "one and done" things.
is easiest for general people to understand.
For probabilities that are much closer to 0 than 1, odds ratio and risk ratio are almost the same. So we can almost interchange them.
But both are for "one and done" things.
ODDS and RISK are when the only thing that matters is THAT people died, NOT WHEN they died.
Whether you die at 5 am or 9 am, of your pneumonia, is no great difference to your family. There is an answer to "did you survive or not", which is what matters.
Whether you die at 5 am or 9 am, of your pneumonia, is no great difference to your family. There is an answer to "did you survive or not", which is what matters.
CHRONIC CONDITIONS
================
In the case of dying of life in general, there is no ultimate escape. Eventually it's gonna get you. The only question is when.
So a treatment that makes life safer for you, doesn't change the "final" percentage. Its 100% one way or another.
================
In the case of dying of life in general, there is no ultimate escape. Eventually it's gonna get you. The only question is when.
So a treatment that makes life safer for you, doesn't change the "final" percentage. Its 100% one way or another.

Have a look at the CONSENSUS trial, of Enalapril in chronic heart failure.
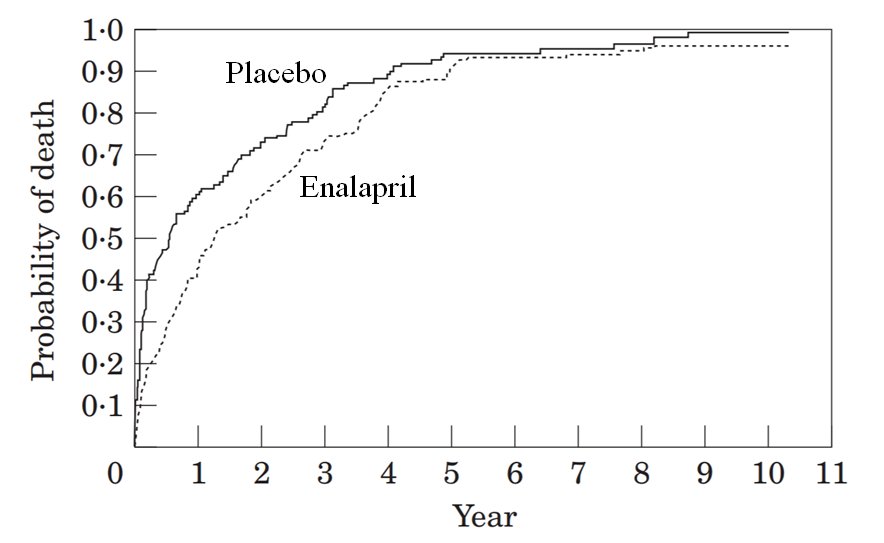
In the placebo arm, what is the risk of death?
In the enalapril arm, what is the risk of death?
So which of these is the closest to the RISK RATIO (also called RELATIVE RISK) for death, in the enalapril arm versus the placebo arm, in the graph shown above?
Not very exciting, eh?
So why are ACEi now routine care in chronic heart failure?
So why are ACEi now routine care in chronic heart failure?
Yes, you calculated all of the above correctly. By the time everyone was dead in one arm, almost everyone was dead in the other arm.
So the relative risk was almost 1.
That's not the way to study the benefit of an intervention in patients who have very severe, lethal disease.
So the relative risk was almost 1.
That's not the way to study the benefit of an intervention in patients who have very severe, lethal disease.
Let's look at another problem with just _counting_ up the deaths.
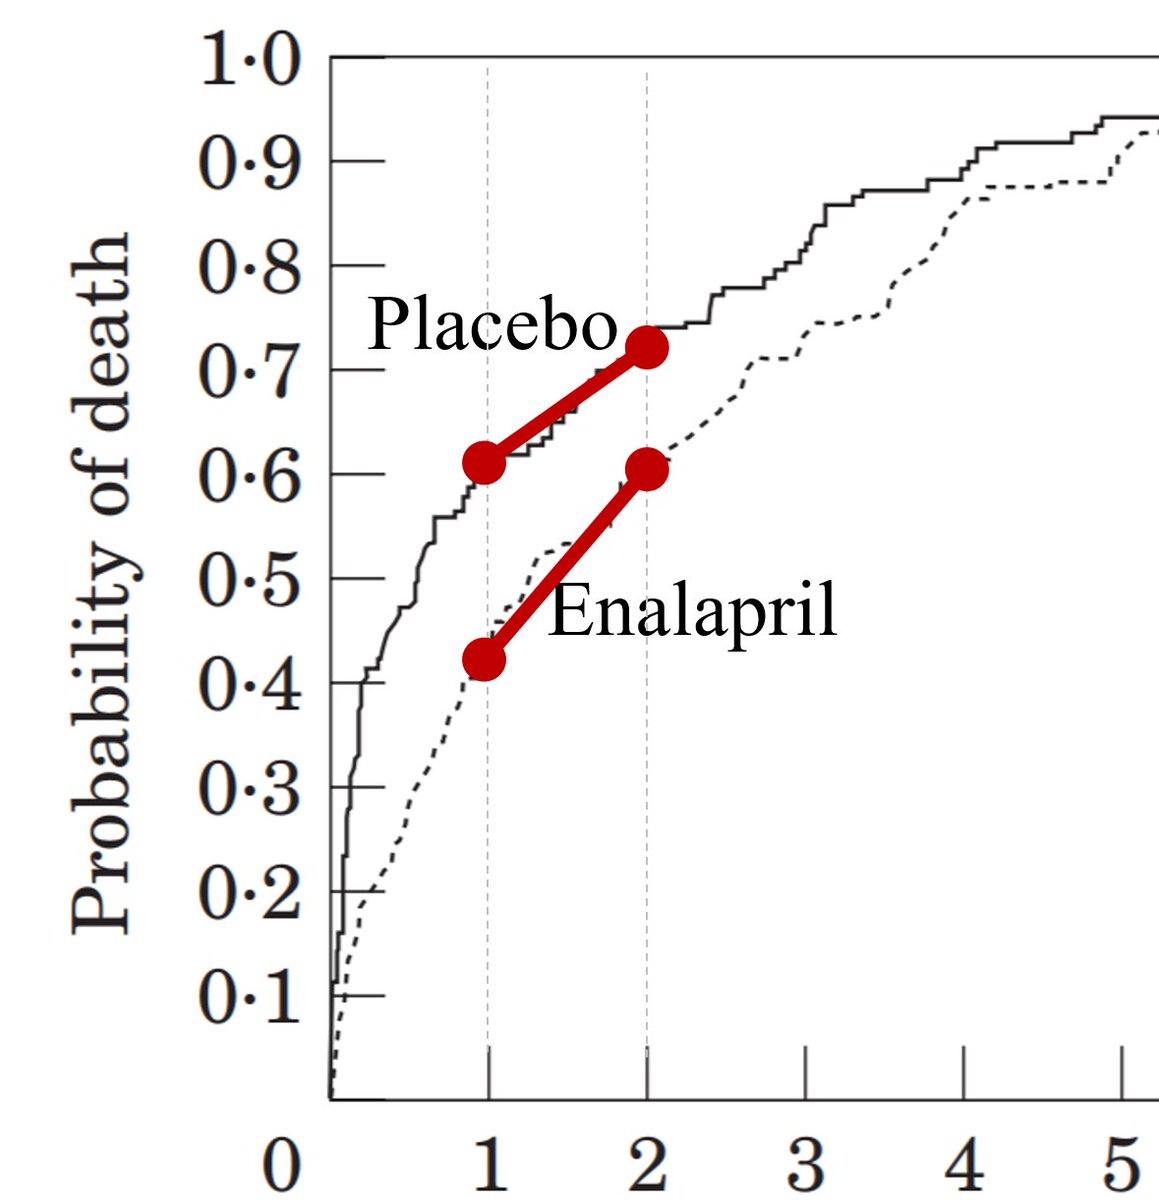
Look carefully at the second year of the trial.
In which arm did MORE ACTUAL PEOPLE die, in the second year?
Look carefully at the second year of the trial.
In which arm did MORE ACTUAL PEOPLE die, in the second year?
Hint:
This is almost the same as asking,
"Which red mortality line is steeper?"
This is almost the same as asking,
"Which red mortality line is steeper?"
Exactly! If we had only turned up at trial HQ at the start of the second year, and ONLY counted the notifications of deaths coming in, we wouldn't have been very happy at the end of the second year.
We'd have convened a secret committee to tell us to change the Primary Endpt to:
We'd have convened a secret committee to tell us to change the Primary Endpt to:
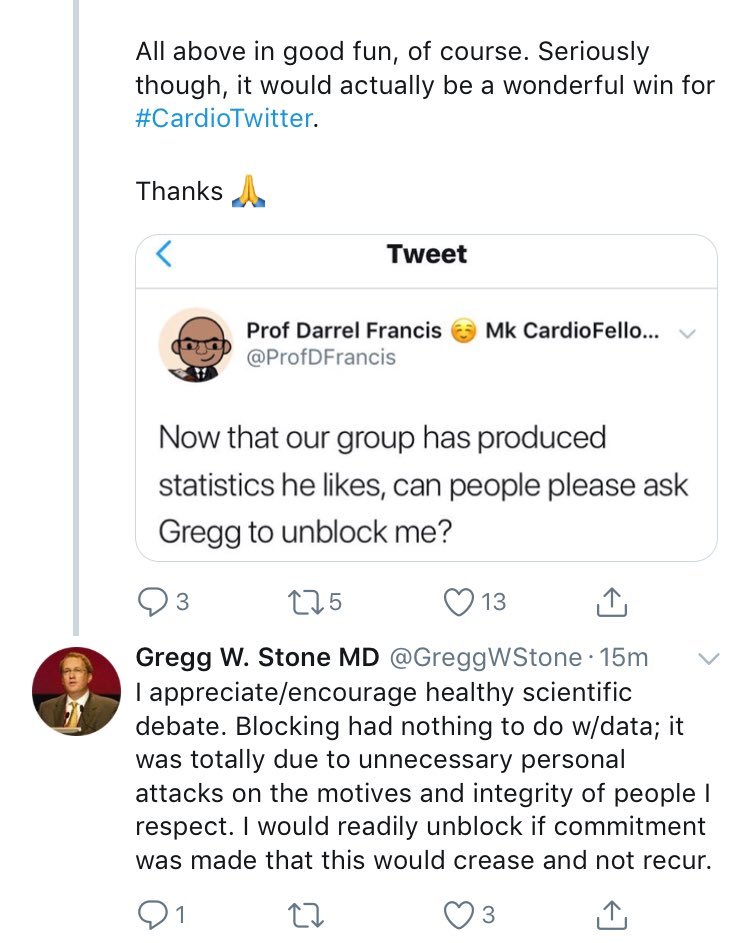
Fortunately, there was no need for this shenanigans, tweeting, letter-to-editoring and blocking.
There's a perfectly good reason why there were more deaths in the enalapril arm than the placebo arm, in the second year:
There's a perfectly good reason why there were more deaths in the enalapril arm than the placebo arm, in the second year:
[Note to statisticians. I am avoiding describing what Cumulative Hazard itself is, as doctors tend to find this, and logging and exping, rather distressing. So I am aiming to go straight for hazard ratio, skipping Hazard.]

The idea of hazard ratio (in my simplified mind) focuses on short periods of time. So short that, roughly speaking, there is a steady rate of death in both arms. Different between the arms, but within each arm steady.
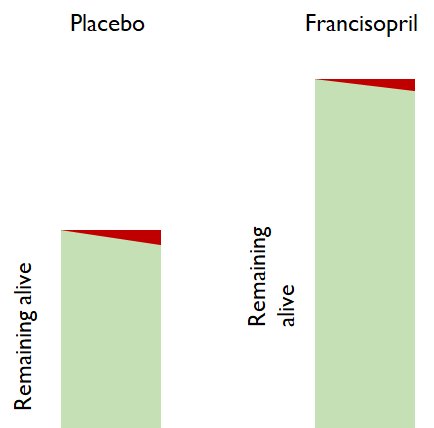
Let's look at a short bit of time in the placebo arm.
Let's look at a short bit of time in the placebo arm.
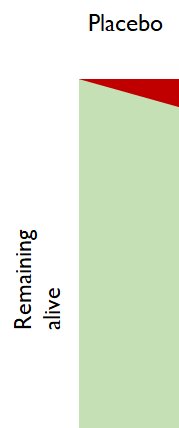
In this short bit of time, roughly what percentage of people died in this arm (placebo).
The deaths are the red wedge, accumulating steadily through time (even though it is a short time).
The deaths are the red wedge, accumulating steadily through time (even though it is a short time).
And now let's look at the treatment arm (Francisopril).
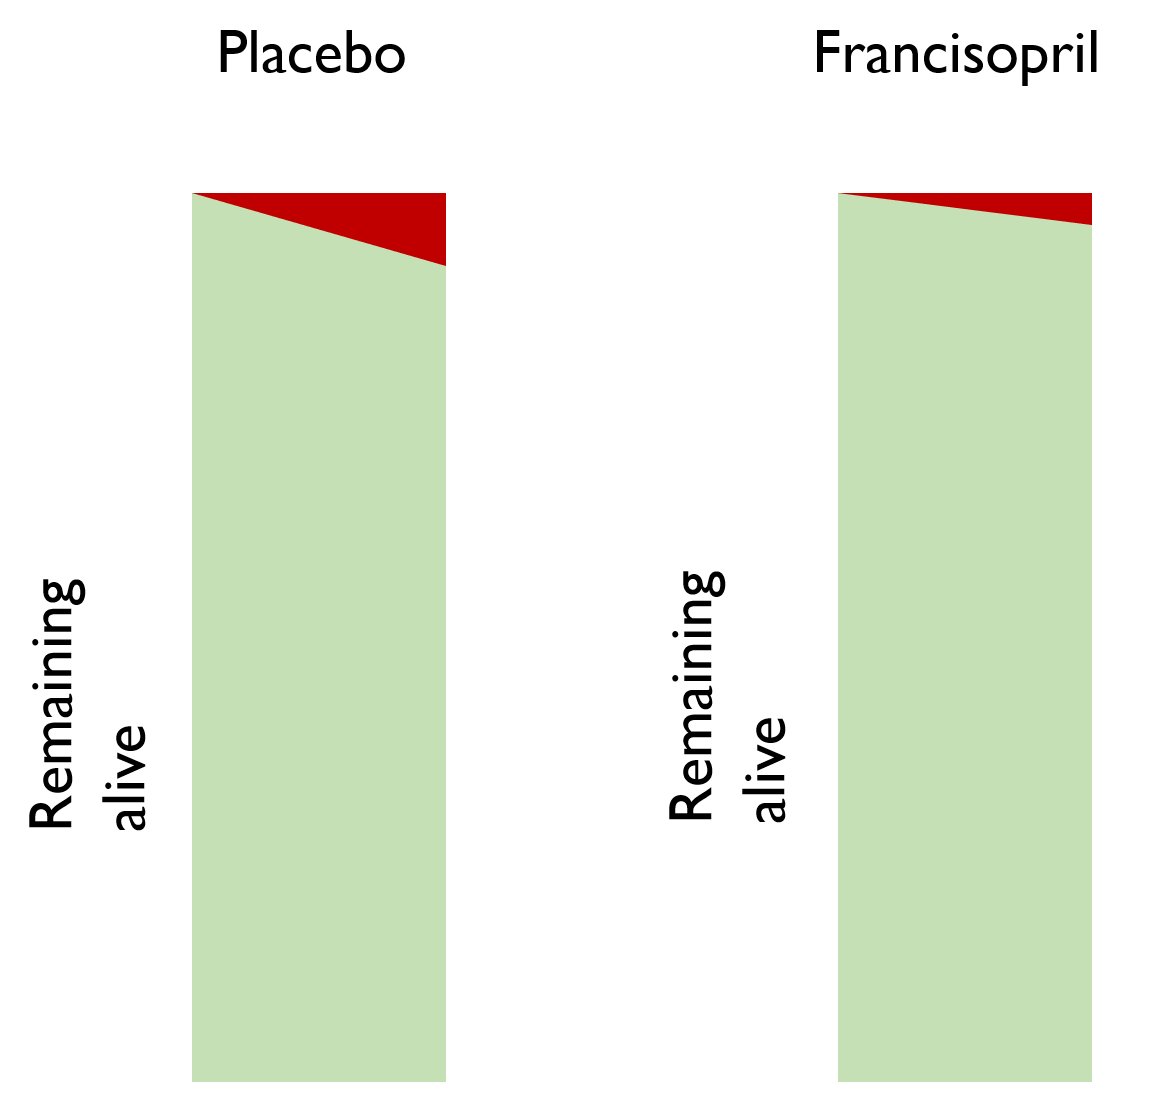
Roughly by eye, what proportion of people died in the Francisopril arm, during this short period of time?
So, in this very short period of time, what is the relative risk in the francisopril arm, versus the placebo arm as reference?
At a later point in the trial, there have been many deaths in the placebo arm.
There have been fewer deaths in the francisopril arm.
There are 80 patients in the francisopril arm, but only 40 in the placebo arm.
As you watch for a while, 4 people die in each arm.
There have been fewer deaths in the francisopril arm.
There are 80 patients in the francisopril arm, but only 40 in the placebo arm.
As you watch for a while, 4 people die in each arm.
For the patients alive at the beginning of this little time segment, what is the relative risk of dying in the francisopril arm, versus in the placebo arm?
Wait: I'm not happy with this answer distributn
In the active arm 4/80 people died
In the control arm 4/40 people died
Think about it. If you now had a free choice of "active" or "control" treatment, which would you take?
4 people died in each arm.
Which arm was better?
In the active arm 4/80 people died
In the control arm 4/40 people died
Think about it. If you now had a free choice of "active" or "control" treatment, which would you take?
4 people died in each arm.
Which arm was better?
Yes!
Don't look at "how many people died in that arm, during that time".
Look at "what PROPORTION of the people in that arm at the start of the time, died during that time."
Which arm had a better mortality rate?
Don't look at "how many people died in that arm, during that time".
Look at "what PROPORTION of the people in that arm at the start of the time, died during that time."
Which arm had a better mortality rate?
So what is the relative risk, during this time window, of being in the active versus the control arm?
I don't normally give the answer away but in this case I feel obliged, due to the still-disappointingly high proportion getting the answer wrong.
If you did NOT pick the majority answer, please click here to be beaten to your senses.
EXPLANATION:
docs.google.com/document/d/1WG…
If you did NOT pick the majority answer, please click here to be beaten to your senses.
EXPLANATION:
docs.google.com/document/d/1WG…
Now, at last, we come to explore the new bit!
Hazard Ratios
Hazard Ratios

Hazard ratios look at each little bit of time from the start of the trial to the end.
In each little bit of time, we ask "how risky is it to live through THIS BIT OF TIME in the active arm, compared with being in the placebo arm".
In each little bit of time, we ask "how risky is it to live through THIS BIT OF TIME in the active arm, compared with being in the placebo arm".
In each little bit of time, what should we ask?
What would you choose, if you are sensibly evaluating the riskiness of each arm?
[A] How MANY people died in the active versus control arms?
[B] What PROPORTION of the people died in the active versus control arms?
What would you choose, if you are sensibly evaluating the riskiness of each arm?
[A] How MANY people died in the active versus control arms?
[B] What PROPORTION of the people died in the active versus control arms?
Suppose you decide to slice a year at a time.
You might start with:
Time | Number or ppl alive
| Active Control
0y | 100 100
1y | 90 80
What is the relative risk of the active arm, for that window of time, from 0 to 1 y?
You might start with:
Time | Number or ppl alive
| Active Control
0y | 100 100
1y | 90 80
What is the relative risk of the active arm, for that window of time, from 0 to 1 y?
That was easy. Hopefully everyone got it right.
Now let's look at the second year, i.e. from t=1yr, to t=2yr.
Time | Number alive
| Active Control
1y | 90 80
2y | 81 72
What is the relative risk during THIS window of time?
Now let's look at the second year, i.e. from t=1yr, to t=2yr.
Time | Number alive
| Active Control
1y | 90 80
2y | 81 72
What is the relative risk during THIS window of time?
If you got the answer to either of the above wrong, please note that when we say "RELATIVE risk", "risk RATIO", "odds RATIO", or "hazard RATIO", we are always comparing an active arm to a control arm.
Some of you were just answering "RISK" in the active arm, not "RELATIVE risk"
Some of you were just answering "RISK" in the active arm, not "RELATIVE risk"
Hint, if you are stuck on either of the above 2 questions.
Step 1. What is the RISK (i.e. proportion of those alive at the beginning of the period, who die during the period) in the active arm?
Step 2. Ditto for control arm.
Step 3. Calculate ratio, active÷control (as always).
Step 1. What is the RISK (i.e. proportion of those alive at the beginning of the period, who die during the period) in the active arm?
Step 2. Ditto for control arm.
Step 3. Calculate ratio, active÷control (as always).
People stuck on the EITHER of the two questions above should click here for more info:
docs.google.com/document/d/1Il…
docs.google.com/document/d/1Il…
Look at the relative risk you found in the FIRST year, and then the relative risk you found in the SECOND year.
Are they the same or different?
Are they the same or different?
In reality throughout any trial, the relative risks at each moment in time keep varying between the two arms.
This is because real life is noisy and wiggly.
We don't want to track all those ups and downs: they are mostly noise and don't tell us anything useful.
This is because real life is noisy and wiggly.
We don't want to track all those ups and downs: they are mostly noise and don't tell us anything useful.
We just want to know, at trial end:
* which arm was more risky on average?
* by how much?
* could this have easily arisen by chance, or is it more dramatic than normally happens by chance, i.e. statistically significant?
i.e. we want an overall Hazard Ratio, a CI and p value.
* which arm was more risky on average?
* by how much?
* could this have easily arisen by chance, or is it more dramatic than normally happens by chance, i.e. statistically significant?
i.e. we want an overall Hazard Ratio, a CI and p value.
Well, here you go.
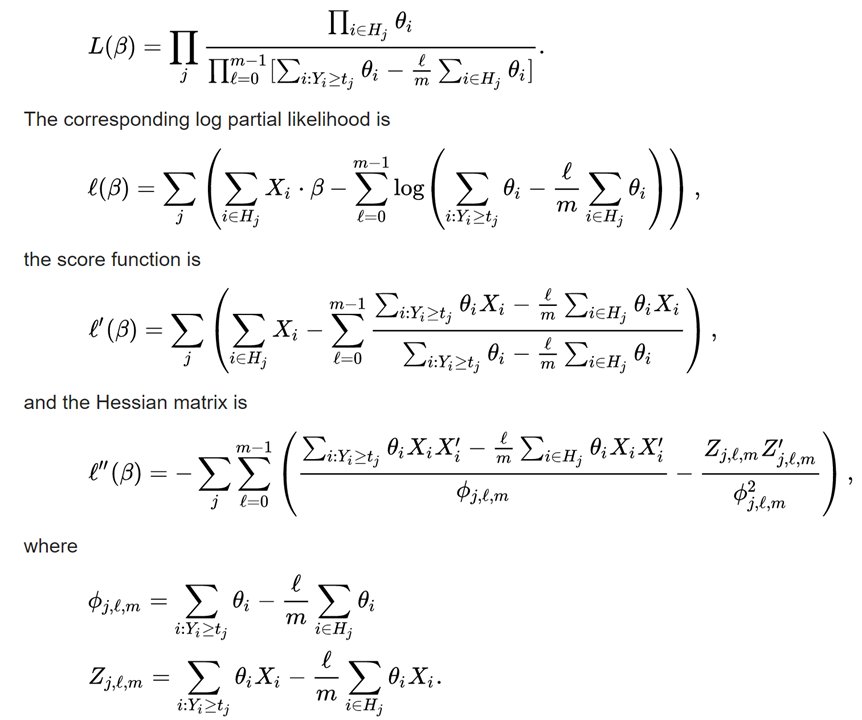
Happy?
For people who are not @f2harrell, @jhoward or @mshunshin, i.e. don't converse in binary or ask for a multi-core GPU for a Christmas present, here is my explanation.
It is not guaranteed to be correct, due to me not really understanding how hazard ratios are calculated.
It is not guaranteed to be correct, due to me not really understanding how hazard ratios are calculated.
However it is good enough for you to be able to convince OTHER people who don't themselves know, i.e. basically everyone.
The Cox Proportional Hazards program makes the ASSUMPTION that at EACH PARTICULAR INSTANT IN TIME, the risk in the active arm is a certain multiple of the risk in the control arm.
Here is the Cox robot:
Here is the Cox robot:

The robot says to itself:
"maybe the active arm is 0.9 x the risk in the control arm, at every point in time,
or maybe 0.8 x,
or maybe 1.2 x?
Which fits the data the best?"
It is finding a SINGLE scale factor that relates the risk in the active to that in the control.
"maybe the active arm is 0.9 x the risk in the control arm, at every point in time,
or maybe 0.8 x,
or maybe 1.2 x?
Which fits the data the best?"
It is finding a SINGLE scale factor that relates the risk in the active to that in the control.
A SINGLE scale factor, NEVER a time-varying scale factor.
Just to be sure you understand what I mean by a single scale factor working across the whole trial, let's do a quick check.
Look at the two event curves in this study below.
Just to be sure you understand what I mean by a single scale factor working across the whole trial, let's do a quick check.
Look at the two event curves in this study below.
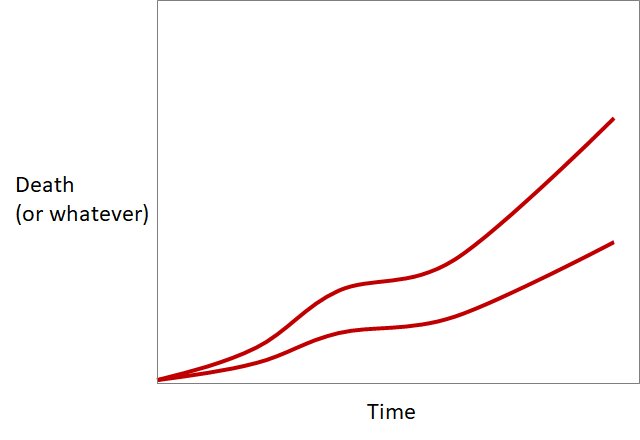
Do you think there is a single scale factor
(a single vertical stretching or shrinking manoeuvre)
that can change one red curve into the other?
(a single vertical stretching or shrinking manoeuvre)
that can change one red curve into the other?
For those disbelievers, here is a hint.
I will re-ask, and suggest those who were in the minority, view the video, before re-answering.
Do you think there is a single scale factor
(a single vertical stretching or shrinking manoeuvre)
that can change one red curve into the other?
Do you think there is a single scale factor
(a single vertical stretching or shrinking manoeuvre)
that can change one red curve into the other?
Question 2.
Look at these 2 curves.
Look at these 2 curves.
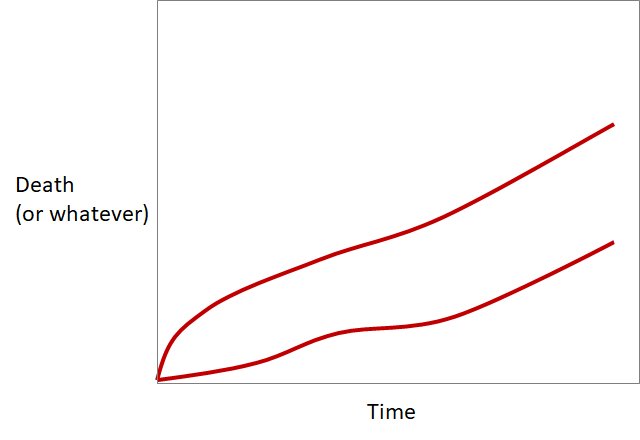
Can one be transformed into the other by a single vertical stretching or shrinking?
I had a call from a Dr G Onstegger.
"You think you are doing something useful with these idiotic tweetorials?
Well you are not!
How many companies line up to get you to run their trials.
I'll give you a clue: NONE.
You can only do trials ordinary riff-raff are interested in"
"You think you are doing something useful with these idiotic tweetorials?
Well you are not!
How many companies line up to get you to run their trials.
I'll give you a clue: NONE.
You can only do trials ordinary riff-raff are interested in"
"Not landmark trials for the Captains of Industry.
And your puzzles are ridiculously easy.
That one you posted this very minute, that people can't solve?
I could do it!
In a second.
So fast it would make your head spin!
Let me show you."
OK, take it away G Onstegger!
And your puzzles are ridiculously easy.
That one you posted this very minute, that people can't solve?
I could do it!
In a second.
So fast it would make your head spin!
Let me show you."
OK, take it away G Onstegger!
The Cox Proportional Hazards calculation system / robot / thingy makes the ASSUMPTION that the scaling is possible, and then does the best possible job of scaling.
It will never be a perfect fit because
It will never be a perfect fit because
But nevertheless it comes up with a best-fitting SINGLE SCALE factor that turns one curve into the other.
Over a very short period of time, Hazard Ratio is is numerically identical to Risk Ratio.
However, over the trial as a whole, Hazard Ratio is weighted in a special way.
Over a very short period of time, Hazard Ratio is is numerically identical to Risk Ratio.
However, over the trial as a whole, Hazard Ratio is weighted in a special way.
The trial-averaged Hazard Ratio is weighted towards the times when we are most confident of the precise value of the Risk Ratio at that time.
For example, at the beginning of the survival graph, there are many patients in it.
Near the end, there are many fewer patients.
For example, at the beginning of the survival graph, there are many patients in it.
Near the end, there are many fewer patients.
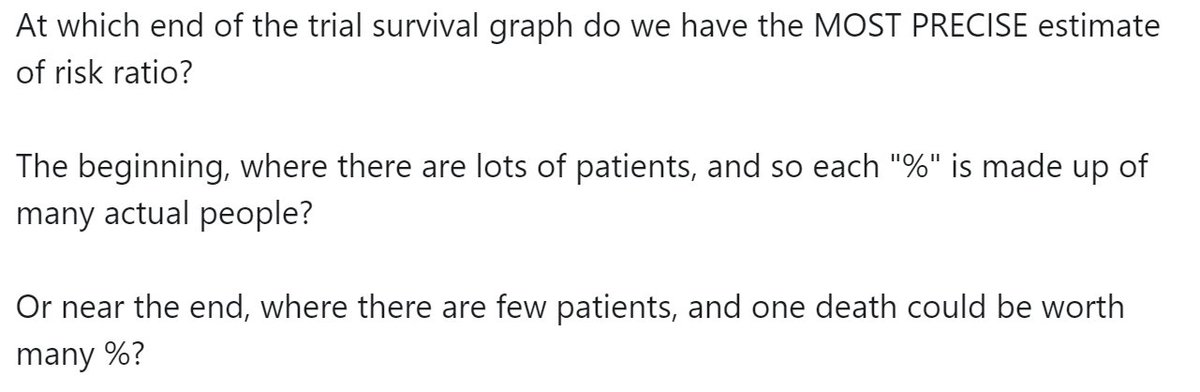
At which end of the trial survival graph do we have the MOST PRECISE estimate of risk ratio?
The beginning, where there are lots of patients, and so each "%" is made up of many actual people?
Or near the end, where there are few patients, and one death could be worth many %?
The beginning, where there are lots of patients, and so each "%" is made up of many actual people?
Or near the end, where there are few patients, and one death could be worth many %?
Wait!
The first two votes to the question of "why will the curves not be an exact scaling of each other" are "because each patient is unique"
What on earth are you thinking?
That was a vacuous moronic "Top-People-speak" phrase I put in that NOBODY should pick.
The first two votes to the question of "why will the curves not be an exact scaling of each other" are "because each patient is unique"
What on earth are you thinking?
That was a vacuous moronic "Top-People-speak" phrase I put in that NOBODY should pick.
It is beloved of panels because:
(a) It is true
(b) It is not the explanation for the question at hand and yet
(c) The average audience member thinks it is some sort of deep analysis.
Next time anyone says that to you, throw a rotten tomato at them.
(a) It is true
(b) It is not the explanation for the question at hand and yet
(c) The average audience member thinks it is some sort of deep analysis.
Next time anyone says that to you, throw a rotten tomato at them.
When they are clearing the pips from their eyes, shout out,
"That tomato was unique too.
Is that relevant?
If it was the same as this tomato [Throw another one]
would it matter?"
That'll teach them.
"That tomato was unique too.
Is that relevant?
If it was the same as this tomato [Throw another one]
would it matter?"
That'll teach them.
The reason the two curves can't be scaled versions of each other is that PEOPLE DIE IN UNITS OF 1.
So the only way for them to be EXACTLY scaled versions of each other, is: EVERY time someone dies in one arm, EXACTLY 2 people die in the other arm at the same moment.
Or similar.
So the only way for them to be EXACTLY scaled versions of each other, is: EVERY time someone dies in one arm, EXACTLY 2 people die in the other arm at the same moment.
Or similar.
The vertical steps being "1 person high" prevent perfect scaling from one to the other.
More info on how those steps arise is in this perma-torial:
medpagetoday.com/publichealthpo…
More info on how those steps arise is in this perma-torial:
medpagetoday.com/publichealthpo…
Next question I asked is also causing people difficulties.
Try this as a hint.
At the beginning, if in a particular month 4% of people die, this might be made up of 40 people out of 1000.
Near the end of the trial, 4% of people dying in a particular month might be made up of 1 person dying out of 25.
At the beginning, if in a particular month 4% of people die, this might be made up of 40 people out of 1000.
Near the end of the trial, 4% of people dying in a particular month might be made up of 1 person dying out of 25.
Which percentage will have the smaller error bar?
The percentage made up of lots of people (4% of 1000, near the beginning of the trial)?
Or the percentage made up of few people (4% of 25, near the end of the trial)?
The percentage made up of lots of people (4% of 1000, near the beginning of the trial)?
Or the percentage made up of few people (4% of 25, near the end of the trial)?
Better! Most people getting it right.
So during SOME periods of the trial we are more confident about what the hazard ratio is, than we are at other periods.
So during SOME periods of the trial we are more confident about what the hazard ratio is, than we are at other periods.
The Cox-calculating robot automatically weights this info in a complex way that I won't be able to explain to you in a way you can understand[*]...
[*] This is because despite extensive deep research, i.e. reading the wikipedia page a few times, I still can't get the hang of it.
[*] This is because despite extensive deep research, i.e. reading the wikipedia page a few times, I still can't get the hang of it.
... and spits out a SINGLE hazard ratio covering the whole trial.
It also gives a confidence interval and P value.
It also gives a confidence interval and P value.
It does NOT give a graph. The graphs we normally see are simply Kaplan-Meier Graphs, calculated in the manner described in the perma-torial above.
Here is a nice example of a condition in which events accumulate gradually over time, i.e. just basically being alive, not just having got out of hospital from a heart attack.
And a therapy (statins) which reduces coronary events by a steady fraction.
And a therapy (statins) which reduces coronary events by a steady fraction.
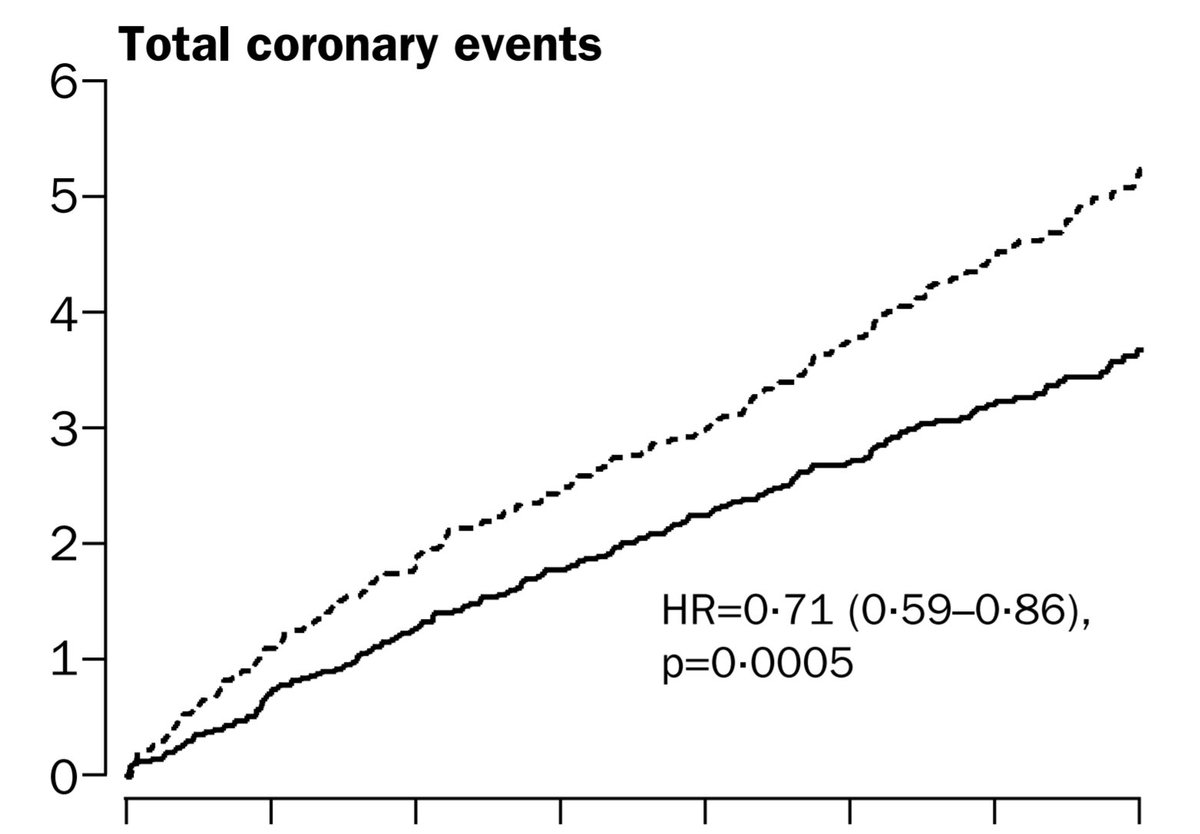
The above was ASCOT-LLA.
Below is the Zijlstra et al NEJM trial of Primary Angioplasty versus Streptokinase for acute MI. We all know how that turned out. It keeps us up at night. (Literally!)
Notice that the graphs are NOT scaled versions of each other.
Below is the Zijlstra et al NEJM trial of Primary Angioplasty versus Streptokinase for acute MI. We all know how that turned out. It keeps us up at night. (Literally!)
Notice that the graphs are NOT scaled versions of each other.
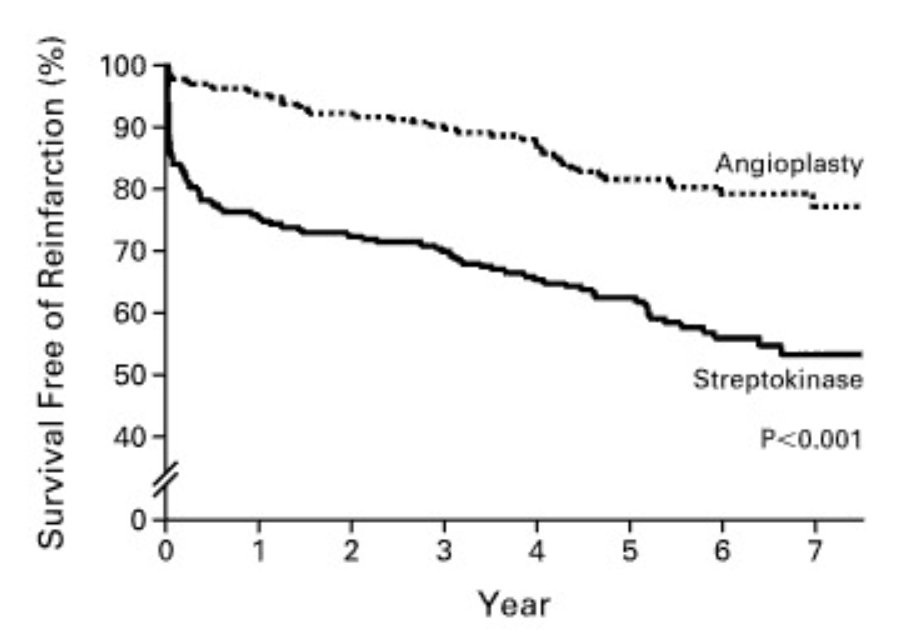
Would they have been right to use the Cox Proportional Hazards model, and calculate a Hazard Ratio for PPCI?
And indeed they did not. They used the simple Kaplan-Meier curve and its corresponding log-rank test to compare the arms, because they were not scaleable versions of each other.
How about that big question we always like to have an opinion about, "CABG versus PCI, which is better" or whatever?
Here are the shapes of the event curves:
Here are the shapes of the event curves:
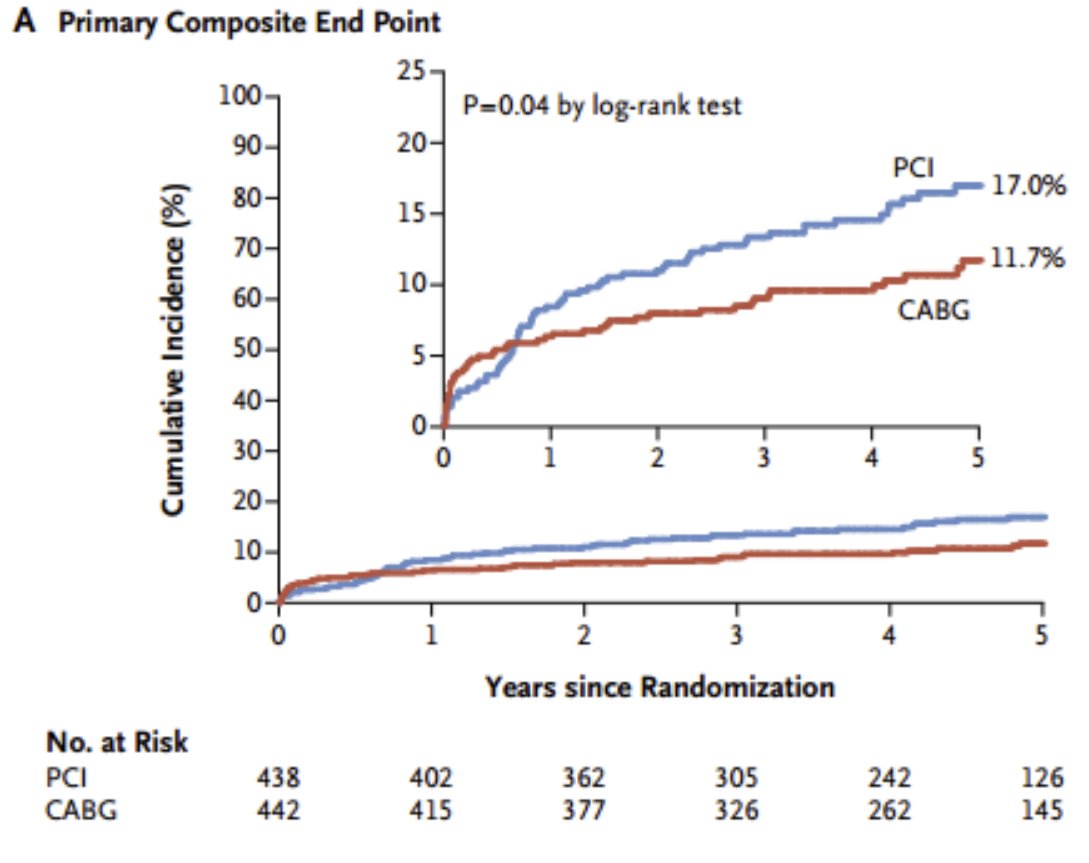
Is PCI a scaled up/down version of the CABG curve?
Well, maybe you think it just a random wobble that is making it look non-scaleable?
Look at other examples, and see. Is the pattern the same?
Is the same one always coming up at higher risk at the beginning, and lower risk later?
Look at other examples, and see. Is the pattern the same?
Is the same one always coming up at higher risk at the beginning, and lower risk later?
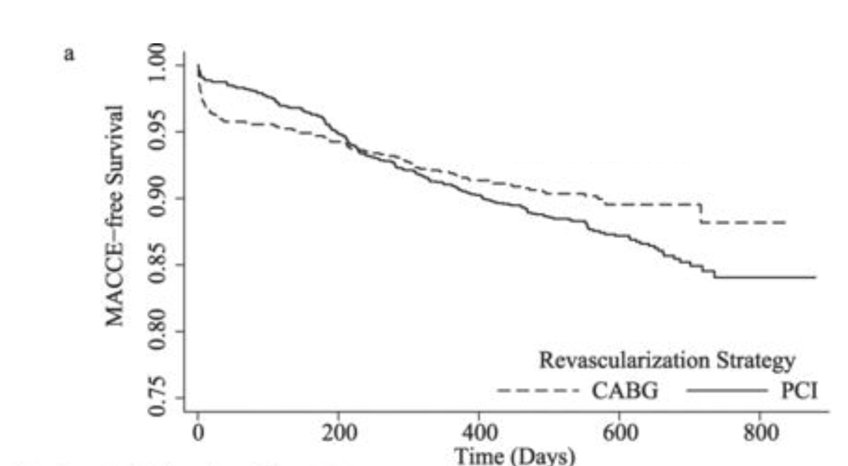
In general, CABG has higher risk than PCI, in the early hours and days after the procedure.
But as time passes, the CABG patients seem to accumulate events slower than the PCI patients.
But as time passes, the CABG patients seem to accumulate events slower than the PCI patients.
Overall, it is close to even.
The earlier your time window of observation, the more it looks like PCI is safer.
The longer you wait before starting to count events, the more it looks like CABG is safer.
But CABG-v-PCI is certainly not a simple proportional hazard.
The earlier your time window of observation, the more it looks like PCI is safer.
The longer you wait before starting to count events, the more it looks like CABG is safer.
But CABG-v-PCI is certainly not a simple proportional hazard.
OK, we are done for this weekend!
Less torturous than most weekends, due to the jollifications Saturday night (happy birthday @rallamee!)
Another weekend I will look at Hazard Ratios per unit something e.g. per mmol/L cholesterol, or per kg weight, and how to interpret them.
Less torturous than most weekends, due to the jollifications Saturday night (happy birthday @rallamee!)
Another weekend I will look at Hazard Ratios per unit something e.g. per mmol/L cholesterol, or per kg weight, and how to interpret them.
Open to questions!
😀
😀
• • •
Missing some Tweet in this thread? You can try to
force a refresh