Here are ten things I’ve changed my mind about in the last few years of being a scientist
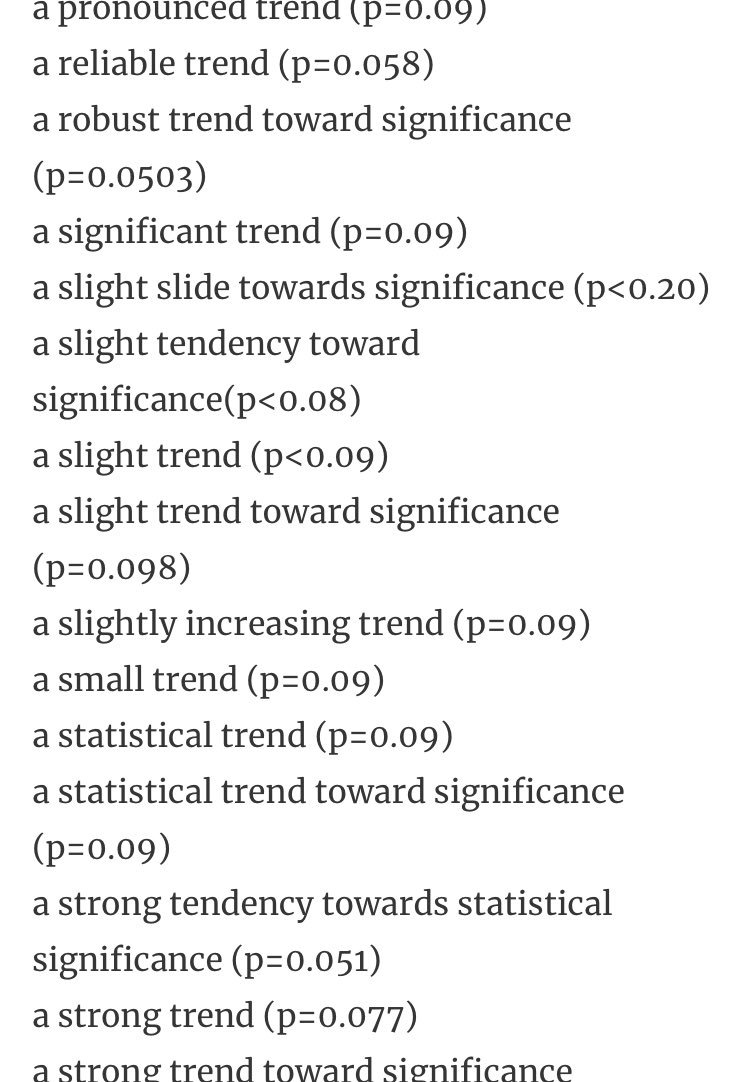
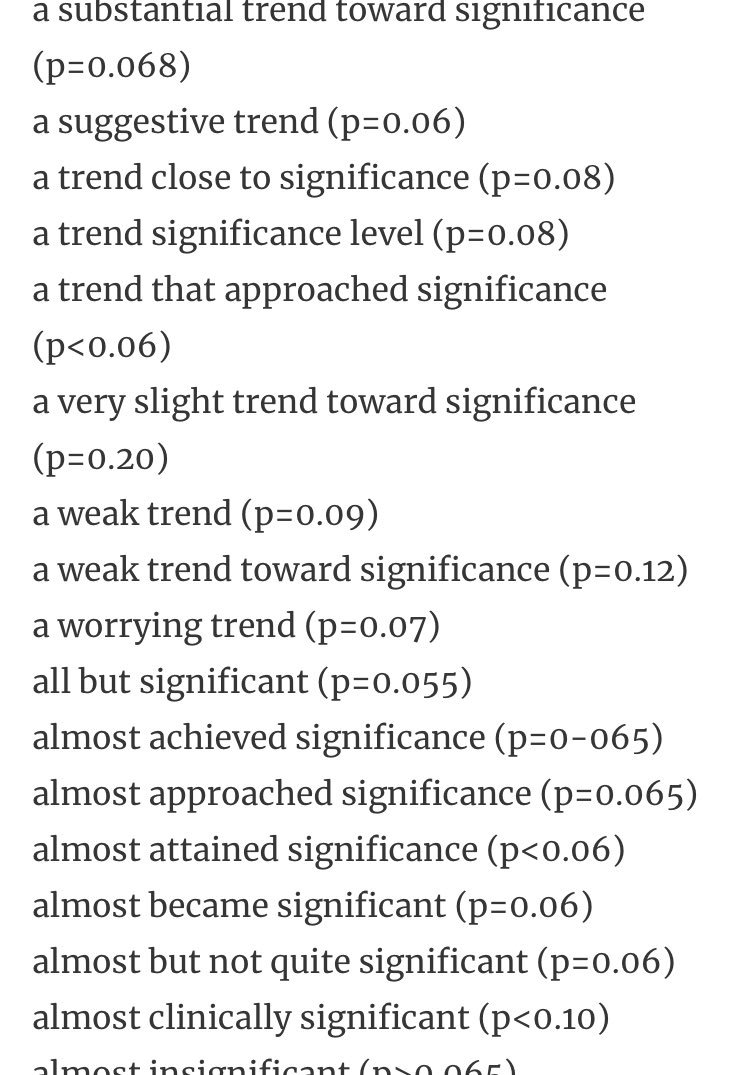
1. P-values are bad.
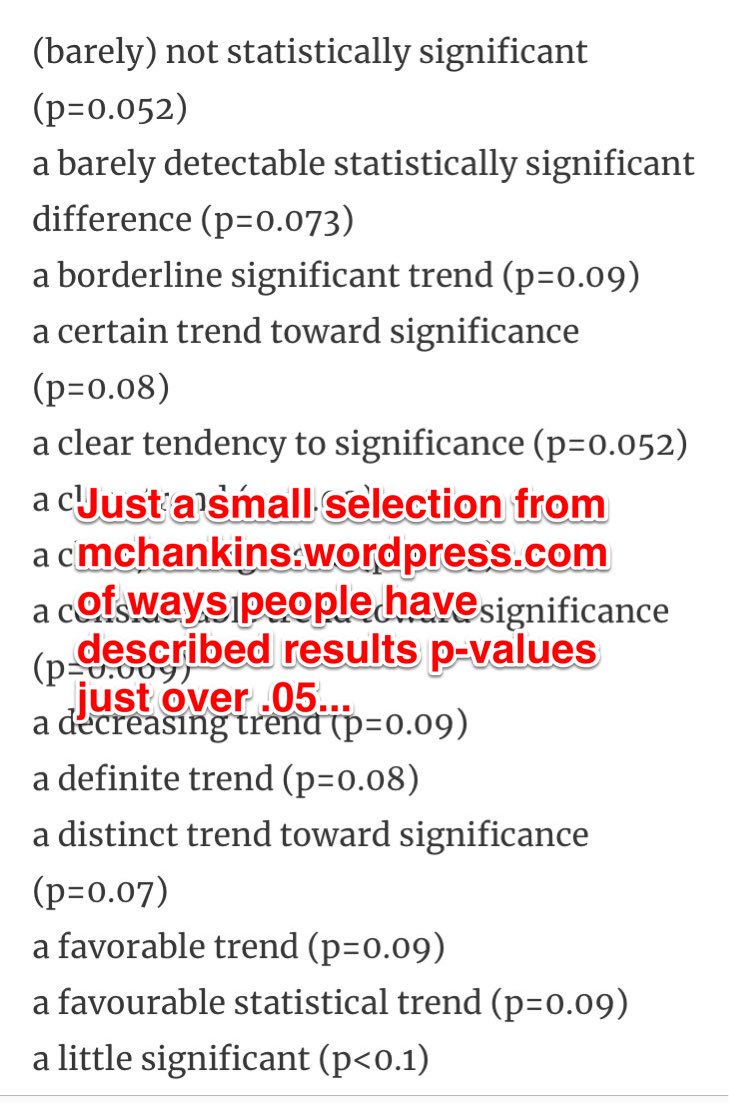
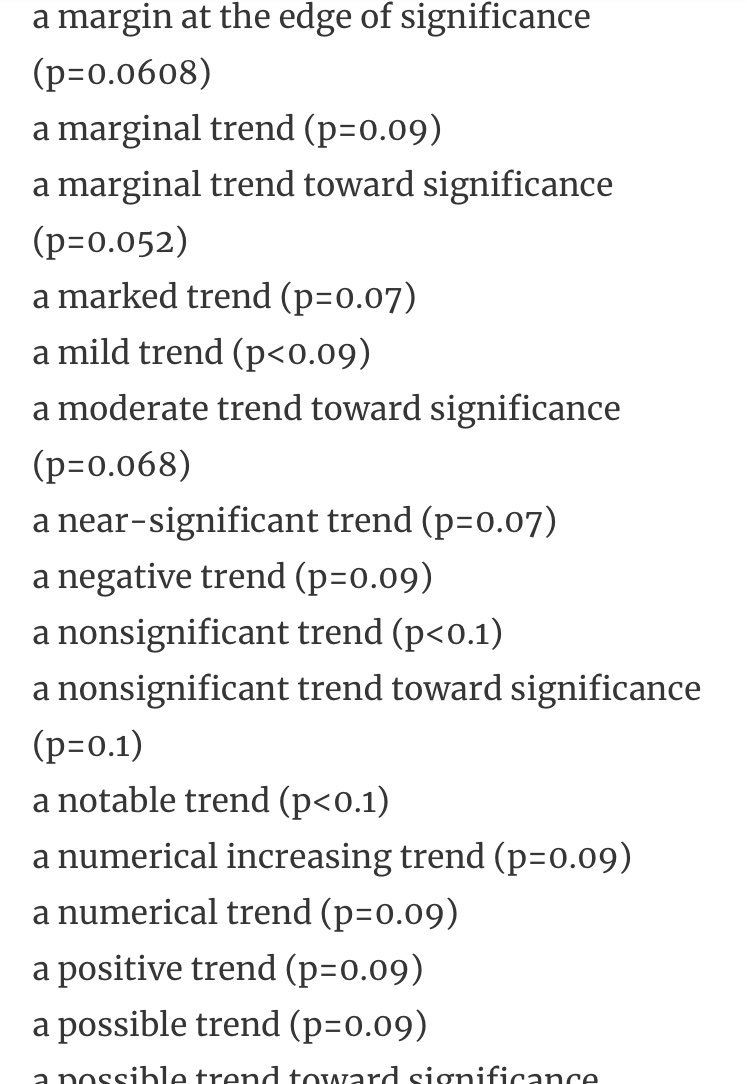
Nope. P-values are good for what they’re designed to do. Just because they’re (often) misused doesn’t mean that we should abandon them.
Nope. P-values are good for what they’re designed to do. Just because they’re (often) misused doesn’t mean that we should abandon them.
2. Bayes factors will save us from the misuse of p-values
No. Bayes factors *can* be useful, but they’re not always the solution to p-value limitations.
No. Bayes factors *can* be useful, but they’re not always the solution to p-value limitations.
3. Everything should pre-registered.
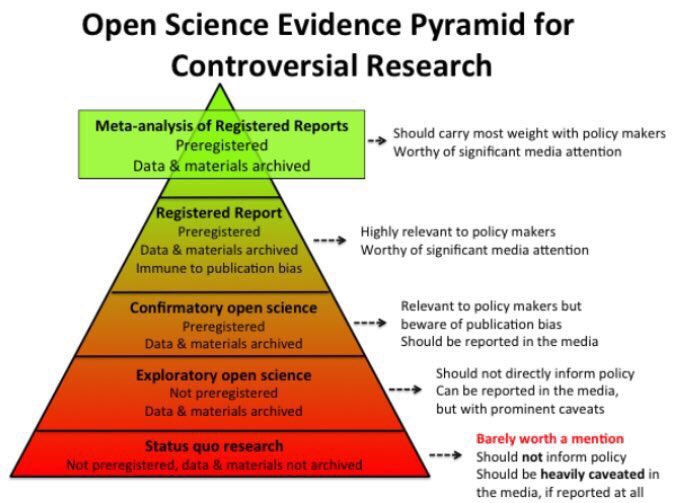
Uh-uh. A study isn’t inherently “bad” if it’s not pre-registered. But it’s more likely to be bad if *pretends* to be
Uh-uh. A study isn’t inherently “bad” if it’s not pre-registered. But it’s more likely to be bad if *pretends* to be
4. Work your arse off and you’ll land papers and grants.
No siree. I’ve seen plenty of researchers with far more talent than me have a long string of rejections. LUCK + hard work = success
No siree. I’ve seen plenty of researchers with far more talent than me have a long string of rejections. LUCK + hard work = success
5. When your colleagues win, you lose.
Nah. Unless you’re competing for the exact same grant, a success for your lab mate is a success for you. Don’t you want to be in a successful lab?
Nah. Unless you’re competing for the exact same grant, a success for your lab mate is a success for you. Don’t you want to be in a successful lab?
6. Keep your ideas to yourself, people will steal them.
Probably not. Ideas are everywhere, but very few people have the resources and persistence to follow through and execute them. Get feedback early! Better to say something wrong in a preprint than a published paper...
Probably not. Ideas are everywhere, but very few people have the resources and persistence to follow through and execute them. Get feedback early! Better to say something wrong in a preprint than a published paper...
7. Presentations that aren’t directly related to your research are a waste of time.
Incorrect. Some of my best research ideas have come from these ‘unrelated’ talks. There’s always *something* you can take away from a talk.
Incorrect. Some of my best research ideas have come from these ‘unrelated’ talks. There’s always *something* you can take away from a talk.
8. Don’t bother with Open Access articles.
Untrue. That frustration I get when I can’t find an article from an obscure journal my rich Uni doesn’t happen to have a subscription to is what most academics experience all time. If you can’t afford #OA, then preprint.
Untrue. That frustration I get when I can’t find an article from an obscure journal my rich Uni doesn’t happen to have a subscription to is what most academics experience all time. If you can’t afford #OA, then preprint.
9. #Rstats is hard, don’t bother learning it if SPSS does everything you need.
False. One of my best academic decisions was taking the time to learn R. It’s flexibility and reproducibility far outweighs the occasional frustration.
Also, GIFs.
False. One of my best academic decisions was taking the time to learn R. It’s flexibility and reproducibility far outweighs the occasional frustration.
Also, GIFs.
10. Twitter is a waste of time, you’re better off writing manuscripts
Nope. I changed my mind about these nine other things from stuff I read on Twitter, and now I write better manuscripts.
Nope. I changed my mind about these nine other things from stuff I read on Twitter, and now I write better manuscripts.
This thread seems to have caught some interest... Here’s a list of a *few* people that I’ve learnt lots from on Twitter:
Open science: @chrisdc77, @jessicapolka, @ceptional
Stats: @lakens, @krstoffr, @EJWagenmakers, @wviechtb
General: @hardsci, @deevybee, @Neuro_Skeptic
Open science: @chrisdc77, @jessicapolka, @ceptional
Stats: @lakens, @krstoffr, @EJWagenmakers, @wviechtb
General: @hardsci, @deevybee, @Neuro_Skeptic
I also co-host @hertzpodcast, which covers many of these topics. Here are a few popular episodes if you're after a new podcast:
Stats: soundcloud.com/everything-her…
Open science: soundcloud.com/everything-her…
Preprints: soundcloud.com/everything-her…
Work/life balance: soundcloud.com/everything-her…
Stats: soundcloud.com/everything-her…
Open science: soundcloud.com/everything-her…
Preprints: soundcloud.com/everything-her…
Work/life balance: soundcloud.com/everything-her…
• • •
Missing some Tweet in this thread? You can try to
force a refresh


