Discover and read the best of Twitter Threads about #nasaglobeobserver
Most recents (1)
2017 #TotalSolarEclipse Data from homemade Solar-X device:
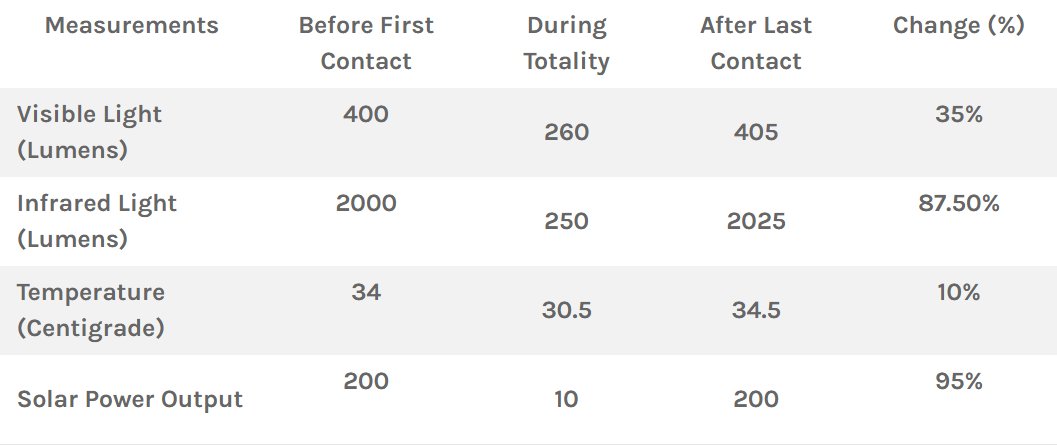
All the sensors: Temperature, Visible, Infrared, UV and Solar power output registered a dip during the Solar Eclipse with peak dips during Totality.
Visible light dropped: 35%
Infrared: 87.5%
Solar Power Output: 95%
All the sensors: Temperature, Visible, Infrared, UV and Solar power output registered a dip during the Solar Eclipse with peak dips during Totality.
Visible light dropped: 35%
Infrared: 87.5%
Solar Power Output: 95%

Solar Cell Output showed the most variation. It dipped gradually at first and then started dipping drastically as Totality neared.
We concluded that a major portion of the Sun had to be covered by the Moon before human eyes notice any measurable change.
We concluded that a major portion of the Sun had to be covered by the Moon before human eyes notice any measurable change.

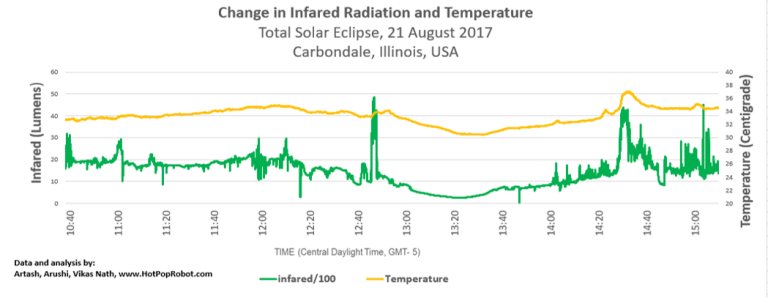
Temperature Change during #TotalSolarEclipse:
Temperature prior to Eclipse (first contact) was 34°C. The temperature readings were slowly rising before the eclipse.
But 1h 20 min into the eclipse, it started dipping. At totality, the temperature had dropped 10%, to 30.5°C.
Temperature prior to Eclipse (first contact) was 34°C. The temperature readings were slowly rising before the eclipse.
But 1h 20 min into the eclipse, it started dipping. At totality, the temperature had dropped 10%, to 30.5°C.

