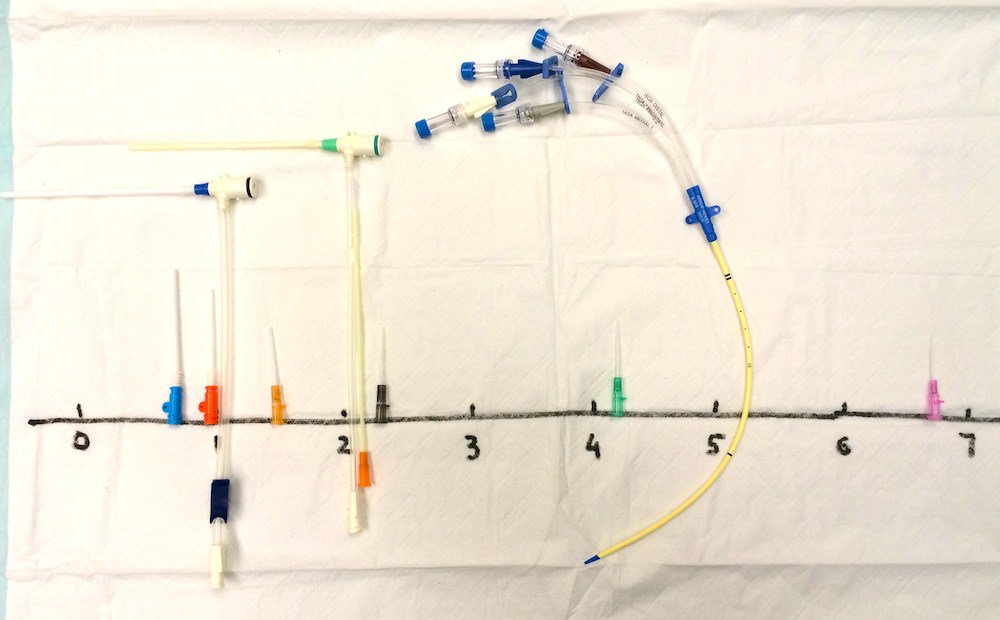
Check out this amazing pictorial showing the relative flow rates of various intravenous catheters. The numbers represent how long in minutes it takes for each catheter to deliver one liter of saline under 300 mmHg of pressure!
<thread>
<thread>

So the catheters are positioned above in order from fastest to slowest going left to right.
Here is a chart listing the catheters from fastest to slowest going top to bottom with their respective infusion times to the second.
2/x
Here is a chart listing the catheters from fastest to slowest going top to bottom with their respective infusion times to the second.
2/x

These varying catheter flow rates can all be simply explained by Poiseuille's Law:
The flow(Q) of fluid is related to the viscosity(n) of the fluid, the pressure gradient across the tubing(P), and the length(L) and diameter(r) of the tubing.
3/x
The flow(Q) of fluid is related to the viscosity(n) of the fluid, the pressure gradient across the tubing(P), and the length(L) and diameter(r) of the tubing.
3/x

This also explains why fluids in hypovolemic shock should always be infused under pressure! And why blood, which is more viscous than crystalloid, takes a longer time to infuse.
But the only 2 intrinsic catheter properties that effect flow are their length and diameter!
4/x
But the only 2 intrinsic catheter properties that effect flow are their length and diameter!
4/x
The larger the catheter diameter, the faster the flow.
But the longer the catheter, the higher the resistance, and therefore the slower the flow.
This is why the 14G port on the quad-lumen central line is slower than the much smaller diameter 18G peripheral IV!
5/x
But the longer the catheter, the higher the resistance, and therefore the slower the flow.
This is why the 14G port on the quad-lumen central line is slower than the much smaller diameter 18G peripheral IV!
5/x
Understanding these concepts and knowing what flow your catheters provide will help guide your resuscitations. Always choose the right catheter(s), for the right patient, at the right time!
Catheter pictorial/chart courtesy:
@edexam, @ETMCourse
#FOAMed
<end>
Catheter pictorial/chart courtesy:
@edexam, @ETMCourse
#FOAMed
<end>
• • •
Missing some Tweet in this thread? You can try to
force a refresh


