Sam Ghali, M.D. Profile picture
ER Doctor | Resuscitation | Airway | Cardiovascular Emergencies | ECGs | Emergency Radiology | Trauma | Critical Care | #FOAMed | Patient Advocate
Sep 2, 2018 6 tweets 3 min read
Check out this amazing pictorial showing the relative flow rates of various intravenous catheters. The numbers represent how long in minutes it takes for each catheter to deliver one liter of saline under 300 mmHg of pressure!

<thread> 
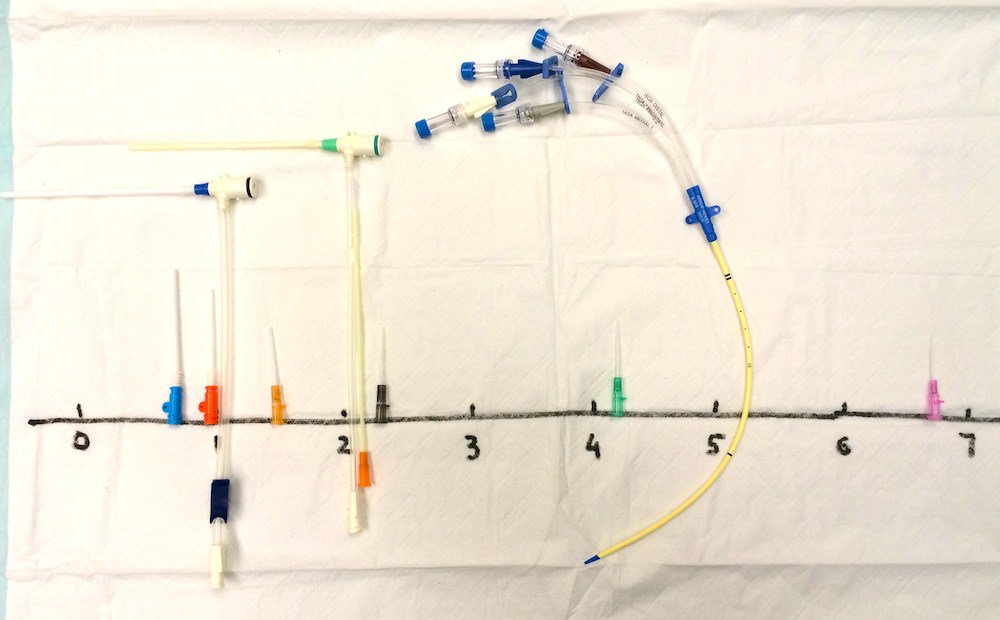
So the catheters are positioned above in order from fastest to slowest going left to right.

Here is a chart listing the catheters from fastest to slowest going top to bottom with their respective infusion times to the second.

2/x