Market Update:
Though I've stated this in previous posts, my current expectation is for weak bullishness near term followed by a strong break down before we put in a significant low.
Though I've stated this in previous posts, my current expectation is for weak bullishness near term followed by a strong break down before we put in a significant low.
Though a wont go into detail here, a few simple reasons for bearish outlook are as follows:
- impulsiveness is with the bears, continuing to see weak responses from bulls
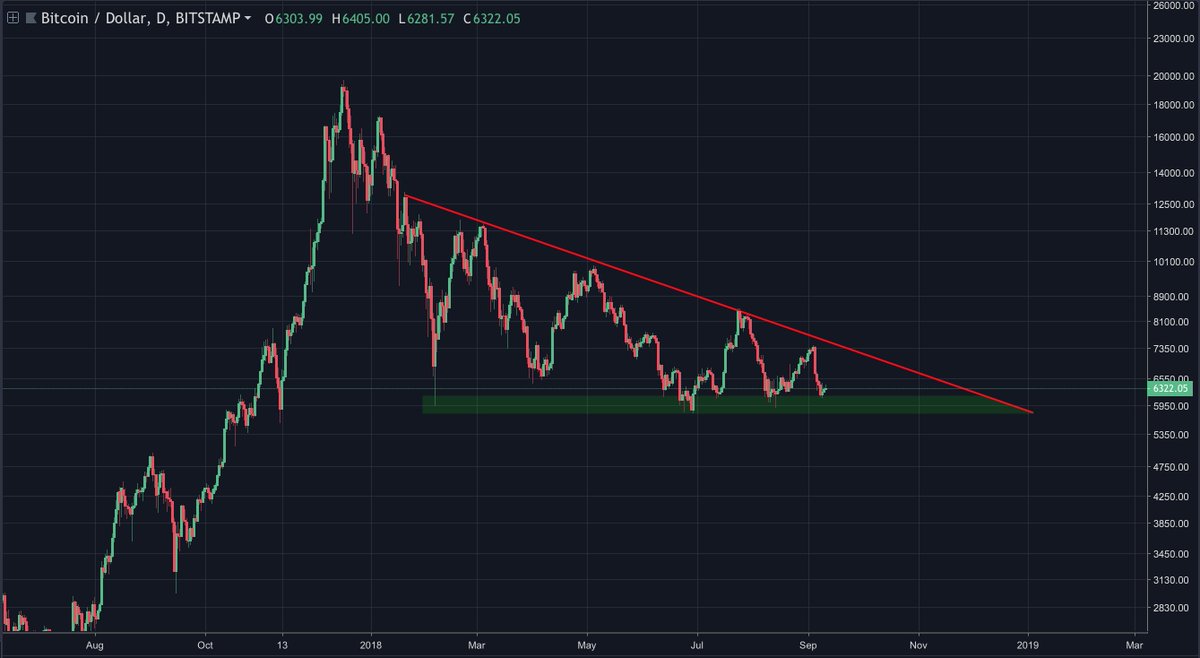
- macro descending triangle structure on $BTC
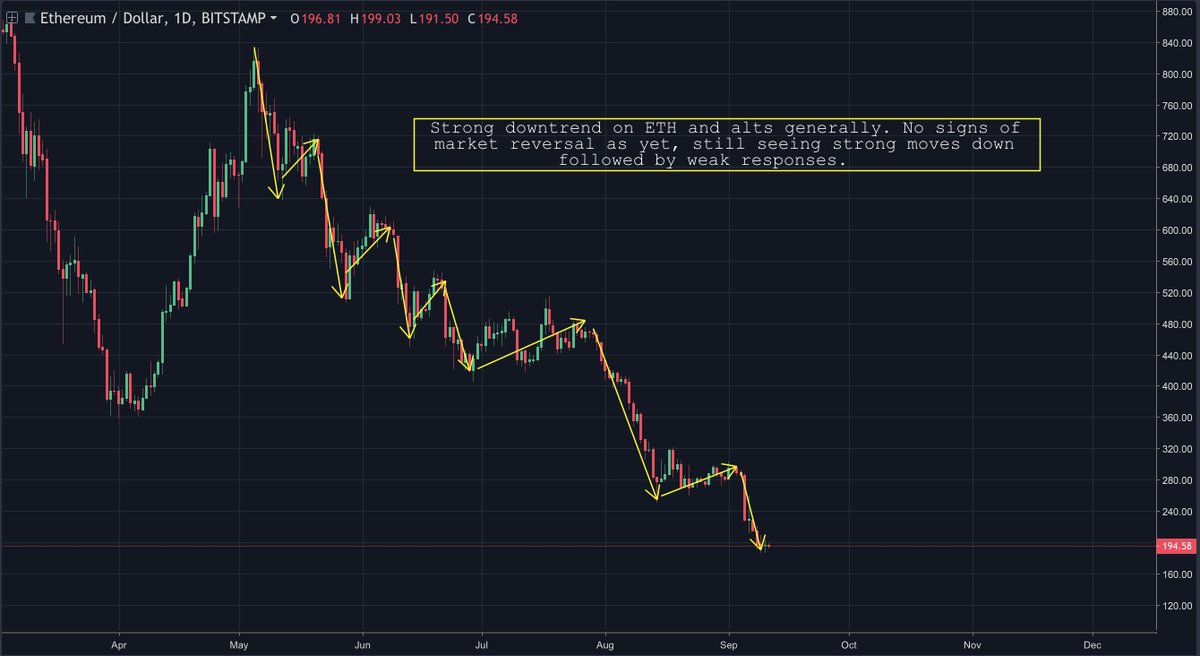
- #alts in steady downtrends, still calling for lower targets

- impulsiveness is with the bears, continuing to see weak responses from bulls
- macro descending triangle structure on $BTC
- #alts in steady downtrends, still calling for lower targets


Until we see high probability bottoming structure, trying to buy every dip is a net losing strategy. Don't fish for bottoms unless they're extremely obvious. Though potential reward is high, it's a bad play risk adjusted.
Despite my mid term bearish outlook, I’m looking for NT respite for a number of reasons. Both $BTC and alts are currently bouncing off of significant support. We’re over-extended to the downside, $BTC has barely rested since dropping nearly 15% in less than a day.
We’ve got unconfirmed inverse H&S structure on $BTC and a number of #alts. Plenty of weak, grinding resistance trends too.
On balance of probability, I’m expecting further grinding upwards NT - a micro version of the rally we saw in August.


On balance of probability, I’m expecting further grinding upwards NT - a micro version of the rally we saw in August.


I’m not looking to trade this long as yet. Counter-trend rallies tend to have a lower hit rate + RR isn’t overly high.
On the contrary, I’m looking to enter short if the rally persists. Though I haven’t yet placed the orders, I may stagger asks between approx $6500 and $6650.
On the contrary, I’m looking to enter short if the rally persists. Though I haven’t yet placed the orders, I may stagger asks between approx $6500 and $6650.
As mentioned in previous posts, this rally would setup volatility funnel structure on $BTC which could project targets in the $4000's and $3000's. I'm tracking this hypothetical setup closely. I'll update if/when it forms and confirms with entries and targets etc. 

$ETH is still looking rough. Nothing signalling for reversal as yet. Still sticking to my low $100’s target based on linked thread.
Primarily looking to short downside continuation setups on #alts NT, though I might open a small long hedge on an inv H&S.
https://twitter.com/Lucid_TA/status/1033615879408218112
Primarily looking to short downside continuation setups on #alts NT, though I might open a small long hedge on an inv H&S.
Though my view is pessimistic, I think there’s a strong case to be made for catching this knife on $ETH, in fact it could be the trade of the year.
Another thing to note, we're likely to see a weekly TD9 on ETH in 2 weeks time which have been significant historically (pictured).


Another thing to note, we're likely to see a weekly TD9 on ETH in 2 weeks time which have been significant historically (pictured).


For me personally, I’ll be staggering bids between $100 - $130 on $ETH. I’ll also have a few sub $100 bids in case we see a cascading stop/forced-liquidation capitulation (or just a wick down through thin books).
Interesting action on long/short differentials. For the longest time longs have outnumbered shorts by a large margin on nearly every alt. That balance is currently shifting which adds weight to the knife catching case as high Q of leveraged shorts helps market to make a bottom. 


I'll update if I see any particularly favourable NT setups, but the main plays I'm looking at now are:
- BTC VF short
- ETH (maybe other alts) near term short if setups manifest
- ETH knife catch long if we capitulate favourably
- BTC VF short
- ETH (maybe other alts) near term short if setups manifest
- ETH knife catch long if we capitulate favourably
I've been significantly less active recently, but that's mostly because my outlook hasn't changed. Most of what has been said here has been posted previously, though I hope you got some value from this nonetheless.
I'll update further as more data emerges.
I'll update further as more data emerges.
• • •
Missing some Tweet in this thread? You can try to
force a refresh


