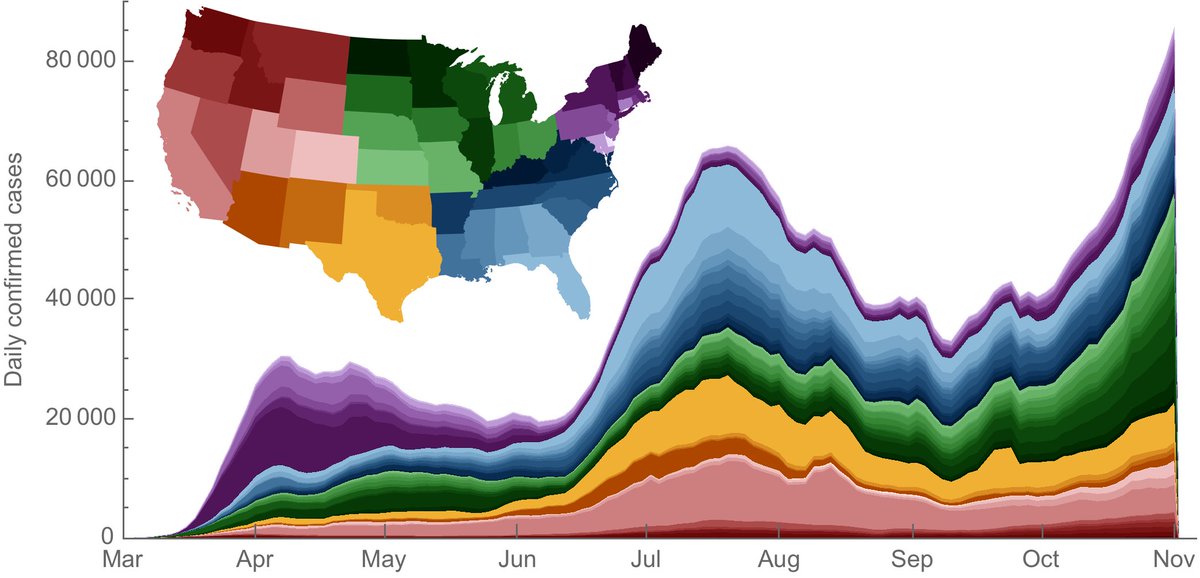
I wanted to respond to news of #COVID19 death in Santa Clara County on Feb 6. This is an interesting, if slightly puzzling, data point. 1/9
We know that there is very little genetic diversity in global samples of SARS-CoV-2, which points to emergence in ~Nov 2019 in Wuhan, China. We know that once community spread is established it ramps quickly in the absence of social distancing. 2/9 
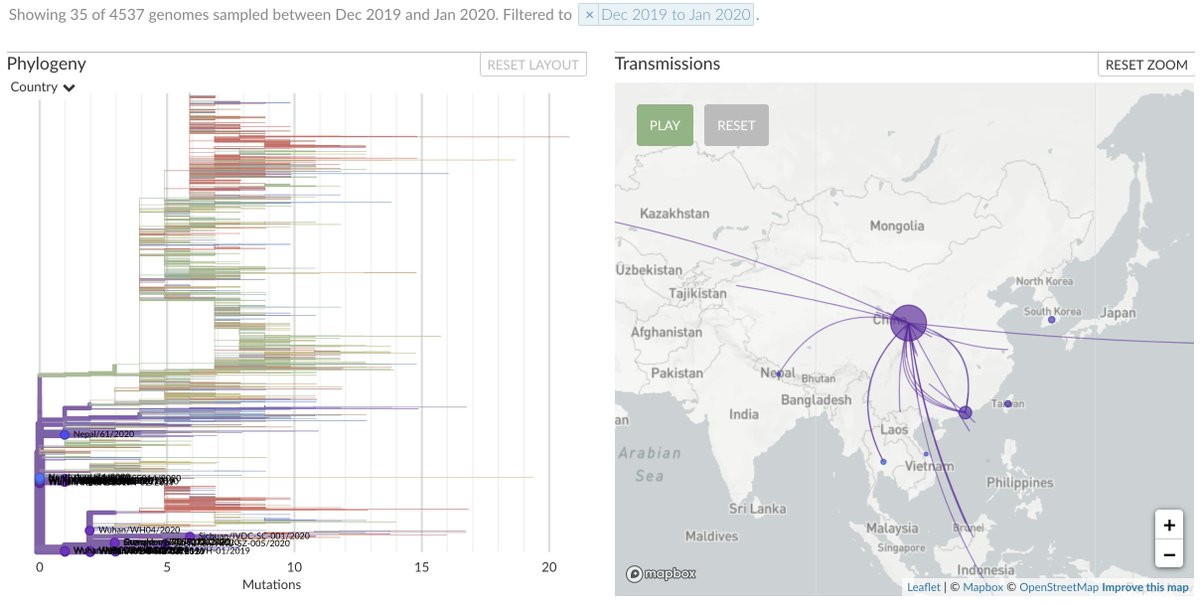
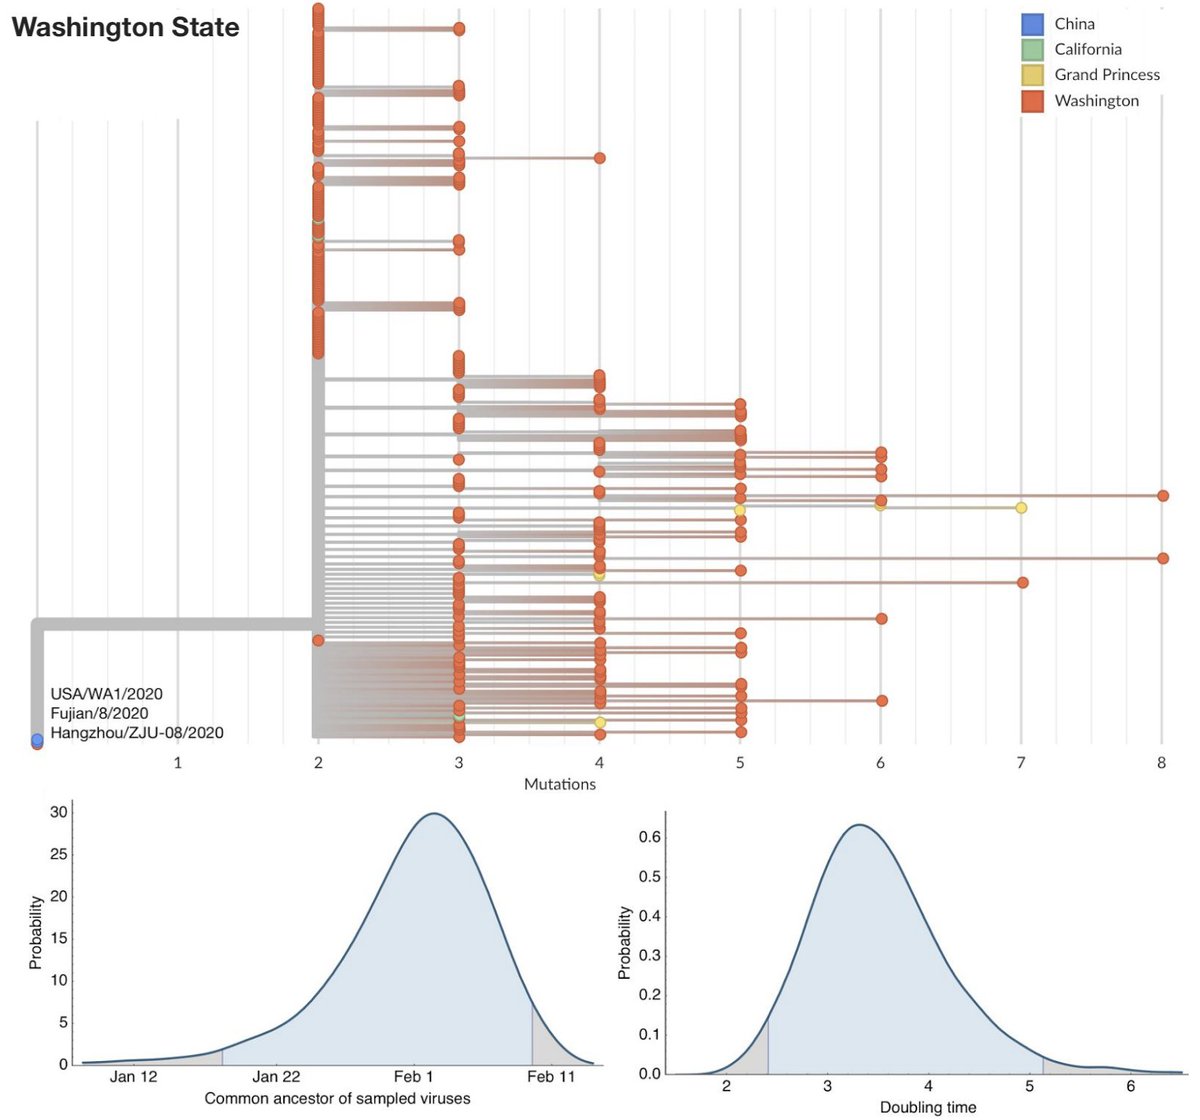
Rate of increase in confirmed cases as well as genomic data suggests a 3-4 day doubling rate. If we look at the abundantly sequenced WA cases we see evidence for an introduction in late January that leads to the majority of cases in March. Figure from bedford.io/papers/bedford…. 3/9 
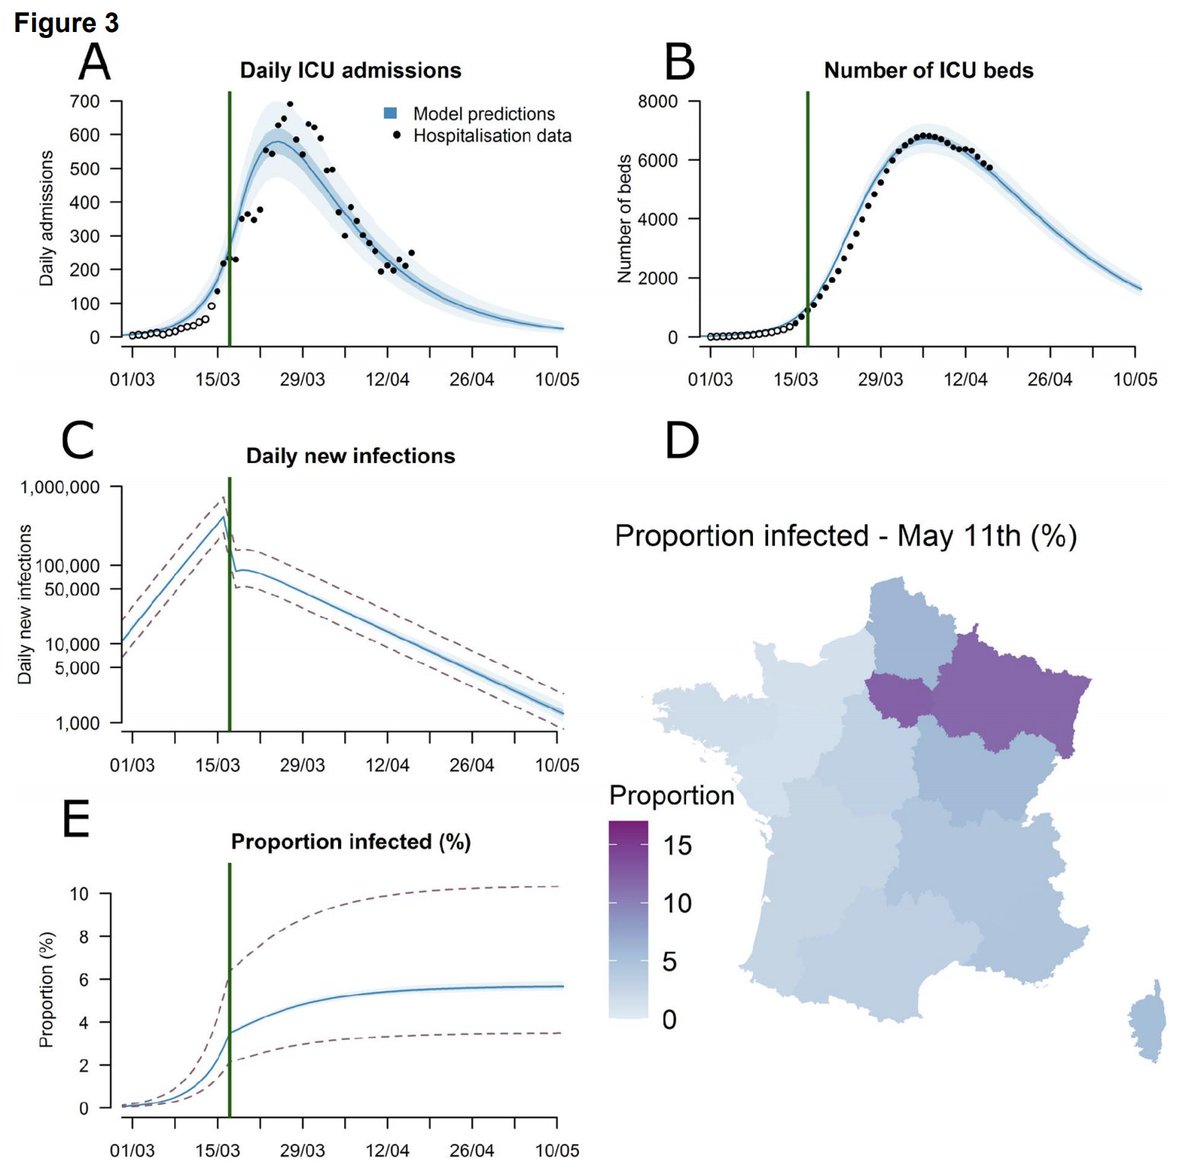
With a 3-day doubling, we can go from a single infection at day 0 to ~1000 infections at day 30. This rapidity of epidemic spread is visible repeatedly across epidemics including New York, Italy and France. Figure from @hsalje et al. (hal-pasteur.archives-ouvertes.fr/pasteur-025481…). 4/9 
Additionally, if we look at a transmission chain in the US, we see that it rapidly bounces between states owing to the level of within-US travel. 5/9 nextstrain.org/ncov/north-ame… 
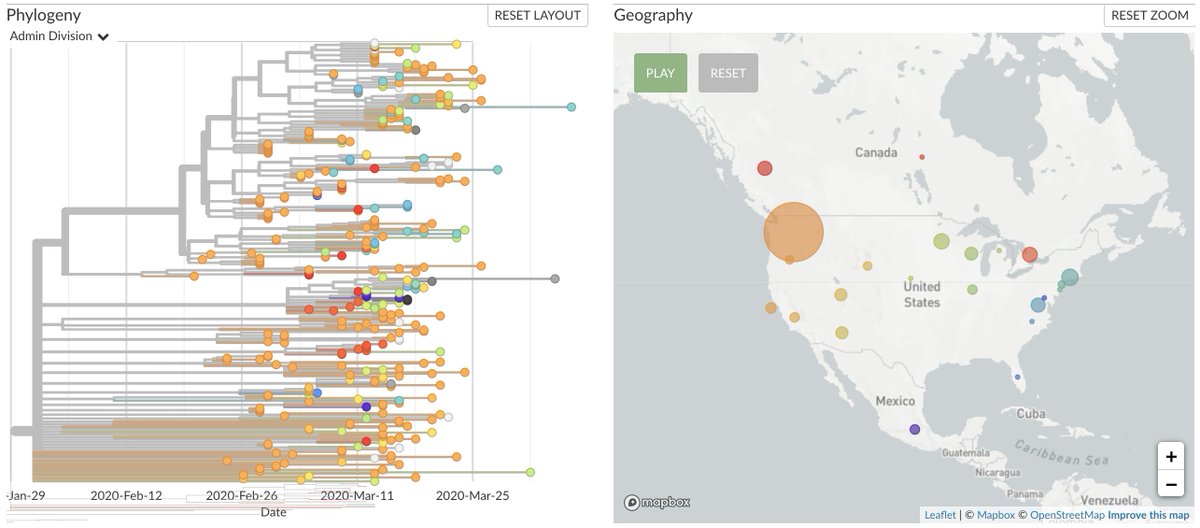
The report of a death in Santa Clara on Feb 6 does not effect my overall timeline of first introductions occurring in the US in Jan 2020 into locations with strong travel connections to China. This death is likely part of one of these early transmission chains. 6/9
The puzzling aspect is the observation that if there was community transmission in Santa Clara in late Jan / early Feb, why didn't we see a similarly early epidemic in Santa Clara as we saw in King County? 7/9
My best guess is that the epidemic in Santa Clara didn't take off for stochastic reasons, despite virus being around in Jan / Feb, but it's also possible the epidemic was less detected in Santa Clara than elsewhere. 8/9
Further viral sequencing of Santa Clara / California samples should help to further clarify timeline. Currently we have 33 genomes. Hopefully more will be sequenced and shared soon. nextstrain.org/ncov/north-ame… 9/9
• • •
Missing some Tweet in this thread? You can try to
force a refresh


