Trevor Bedford Profile picture
Nov 11, 2020 8 tweets 3 min read Twitter logo Read on Twitter
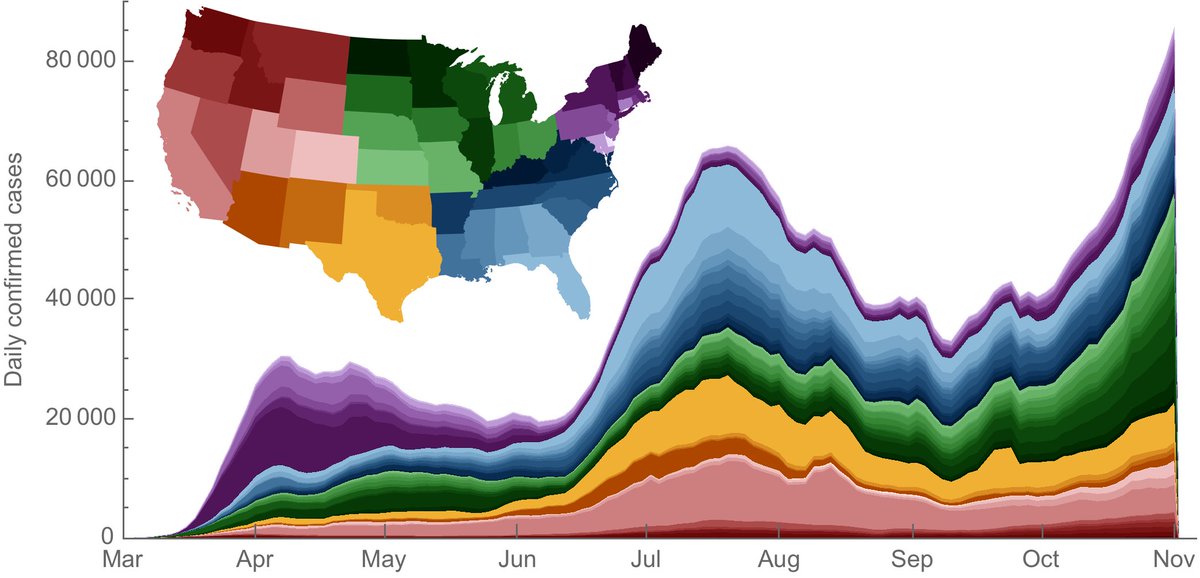
After posting about sharply rising #COVID19 cases Friday, there were multiple replies to the effect of "but deaths aren't going up". As should be obvious to most at this point, (reported) deaths lag (reported) cases. This thread investigates. 1/8
There is a lag between when a case is diagnosed and when the individual may succumb to their disease and there is a further lag between date of death and when the death is reported. 2/8
Here, I compare state-level data from @COVID19Tracking for cases and deaths and find that a 22-day lag maximizes state-level correlations. 3/8
This can be seen across states where the solid lines show reported cases by date of report and dashed lines show reported deaths lagged by 22 days. You can see some detailed correspondences, especially in states experiencing the summer surge like Florida, Arizona and Texas. 4/8
Given this 22-day lag we can compute a lag-adjusted case fatality rate (CFR) by dividing reported deaths at day t by reported cases at day t - 22. This declines from ~6% in April, averaging 1.8% after August. 5/8
Looking backwards, this lag-adjusted CFR means that 991 deaths in the US today (with 7-day smoothing) should be compared against 57,206 cases reported Oct 19 (with 7-day smoothing). In this case, 991/57206 = 1.7% is consistent with this overall lag-adjusted CFR. 6/8
Or looking forwards, this lag-adjusted CFR suggests that 118,976 reported cases today (with 7-day smoothing) will translate to ~2150 deaths reported in 22 days on Dec 2. 7/8
I expect the US to be reporting over 2000 deaths per day in 3 weeks time. Importantly, this doesn't assume any further increases in circulation and is essentially "baked into" currently reported cases and represents conditions that take time to resolve and to be reported. 8/8

• • •

Missing some Tweet in this thread? You can try to force a refresh
 

Keep Current with Trevor Bedford

Trevor Bedford Profile picture

Stay in touch and get notified when new unrolls are available from this author!

Read all threads

This Thread may be Removed Anytime!

PDF

Twitter may remove this content at anytime! Save it as PDF for later use!

Try unrolling a thread yourself!

how to unroll video
  1. Follow @ThreadReaderApp to mention us!

  2. From a Twitter thread mention us with a keyword "unroll"
@threadreaderapp unroll

Practice here first or read more on our help page!

More from @trvrb

Dec 4, 2020
The US is reporting over 2000 deaths per day from Dec 1 and I believe will do so consistently throughout December based on daily case loads above 120k starting early November. 1/4
A drop in reporting over Thanksgiving weekend has made for some difficulty in directly comparing 7-day averaged deaths, but the trend is clear. Red bars are daily reported deaths from @COVID19Tracking and black line is 7-day sliding average. 2/4
The simple projection of 1.7% of reported cases into deaths 22 days later has remained largely accurate, although drop of reporting during Thanksgiving weekend is quite clear. We'll know soon whether 7-day average returns back to projection. 3/4
Read 4 tweets
Nov 7, 2020
I know that everyone has been (justifiably) distracted by other things, but the #COVID19 epidemic in the US is looking pretty dire with 125,552 confirmed cases reported Friday by @COVID19Tracking. 1/10
Please consider this somewhat of a follow up to the thread two weeks ago on circulation patterns across states. 2/10
Confirmed cases have continued to tick up across the US, though with the Midwest and Mountain West contributing to most of the recent increase. Data from @COVID19Tracking. 3/10 Image
Read 10 tweets
Apr 22, 2020
I wanted to respond to news of #COVID19 death in Santa Clara County on Feb 6. This is an interesting, if slightly puzzling, data point. 1/9
We know that there is very little genetic diversity in global samples of SARS-CoV-2, which points to emergence in ~Nov 2019 in Wuhan, China. We know that once community spread is established it ramps quickly in the absence of social distancing. 2/9
Rate of increase in confirmed cases as well as genomic data suggests a 3-4 day doubling rate. If we look at the abundantly sequenced WA cases we see evidence for an introduction in late January that leads to the majority of cases in March. Figure from bedford.io/papers/bedford…. 3/9
Read 9 tweets

Did Thread Reader help you today?

Support us! We are indie developers!


This site is made by just two indie developers on a laptop doing marketing, support and development! Read more about the story.

Become a Premium Member ($3/month or $30/year) and get exclusive features!

Become Premium

Don't want to be a Premium member but still want to support us?

Make a small donation by buying us coffee ($5) or help with server cost ($10)

Donate via Paypal

Or Donate anonymously using crypto!

Ethereum

0xfe58350B80634f60Fa6Dc149a72b4DFbc17D341E copy

Bitcoin

3ATGMxNzCUFzxpMCHL5sWSt4DVtS8UqXpi copy

Thank you for your support!

Follow Us on Twitter!

:(