Willy Woo Profile picture
Dec 3, 2017 33 tweets 10 min read Twitter logo Read on Twitter
My #consensusinvest talk in a bunch of tweets. Special thanks to @CoinDesk for making the day possible. Hoping we’ll see a video edit soon. /1 
I don’t come from Wall St. I’m not a formally trained analyst. My background comes from the world of emerging tech and startups. Hence my view and analysis tends to be outside of the box. /2
I publish brain farts! /3
This is a brief overview of some of my stuff. Maybe we should call this "Woobull’s greatest hits". /4
I published this "3 cats and a moon" fractal pattern that BTC reliably traded for 3 years around Feb this year. Interestingly it ceased to work after publication. /5
This was at the time of the ETF decision, my theory was that Wall St money failed to enter via an ETF, so instead directly bought in around Mar 2017, that changed the psychological trading profile that Bitcoin was trading. A new animal had entered the market. /6
Interestingly, at the Bcash fork, I also noted that BCH started trading the 3 cats pattern, which suggested to me that the old time Bitcoiners were trading this market, not the normal Bitcoiner + Wall St Hybrid we were seeing in the BTC market. /7
NVT Ratio is another invention of mine. This works like Bitcoin’s PE Ratio, indicating when BTC price has outstripped fundamental value, also like PE Ratio for young fast growth companies, it is higher in the earlier high growth phase for Bitcoin. /8
Note this is a laggy indicator and is best used to distinguish overvaluation (hence bear season) from a consolidation during the dead-cat bounce phase of a price correction.

More here: forbes.com/sites/wwoo/201…

/9
OK... where are we today in 2017? We are at 0.5% of the world M2 money supply. /10
We are at ~1% of world population as users. (Estimates range from 1-3%). This is equivalent to 1996 for the Internet. /11
With Bitcoin we are seeing user count double every 12 months. This was calculated with my work tracking Google Trends data on the assumption that users search BTCUSD price.

More here: woobull.com/woos-law-of-bi…

/12
If this trend continues, we are 9 years away from half the world using Bitcoin. /13
Here’s another view of #Bitcoin’s growth on a long term chart. Remember, each altitude climb here is a 10x. All crypto together today is only 0.5% of World M2 Money. /14
Seems small but we are 66% of the way on our journey to usurp USD M1 money. Let me reiterate, Bitcoin is 4 years out from exceeding the world reserve currency. Sounds radical, no? /15
The data suggests by 2022, Bitcoin’s volatility will also be nearly as low as fiat FOREX. This means grandma can have a USD savings account earning 1% per year, or she can have a BTC savings account earning 1% per week at similar risk profiles. /16
Now #Bitcoin is not the only story to be told here. We have strong competing altcoins that are on an even higher trajectory, they may even cross USD M1 before Bitcoin. I’ve removed some of the top 10 coins to make this chart clearer. /17
So let me zoom out a bit and talk about the 10,000 year view.

In 2013 they called it drug money. In 2017 they called it a bubble. It’s not in a bubble. We’re on the final part of digitising the world. /18
We are seeing the final phase of the Post Industrial Revolution which started in the 60s-90s with the invention of the microprocessor through to the expansion of the Internet. /19
Bitcoin is not just money. It’s the invention of an Internet-native digital scarcity. And with that breakthrough, software will eat the financial world. /20
Blockchain assets will be bigger than the ~70 trillion in money, there’s another 80 trillion in equities, and I’m told well over 200 trillion in real estate. This will all be digitised. /20
So where are we in 2018? /21
Stealth, Awareness, Mania, and Blow-off are the stages of the investment cycle. With Bitcoin only the Geek money invested in the Stealth Phase. Smart money was displaced to the Awareness Phase. /22
Normally institutional money arrives during the Awareness Phase, but due to regulatory bars institutions were not allowed to enter. Hence we are now seeing institutional money compete with retail money to create a super bull season right now in Q4 2017 and into 2018. /23
We are also seeing #Bitcoin dominance reducing over the long term. This is a sign of the markets maturing as a fully digital economy should not be 95% money. All industries will eventually fill this economy when this fully matures. (data by Coinmarketcap) /24
So let’s look at the individual performance of the other coins. This is a chart of the top 125 coins. As you can see there are plenty of investment opportunities that can outperform #Bitcoin. /25
That last slide was the top 125 outliers, this chart shows essentially the entire market. The darker colours represent the top 200, 400, 600 etc. Newer coins are outperforming older coins in general. Also buying the entire market tends to be neutral in performance. /26
Selection and filtering is key. /27
I suggest selecting just as a VC would. Vet the team, call them up, are they competent? Check their tech, read their source code, is the tech stack useful? How big can the market grow to? What are the token dynamics, is the token designed for high velocity or low? /28
Successful projects will follow what I call the Falcon 9 launch trajectory. /29
Ride the early steep trajectory for 2-3 years, then roll the investment into new projects capable of climbing steeply. It’s a VC model. Returns that #Bitcoin offered in 2011-2013 are still available today, but there’s work involve to find the gems. /30
Thank you, and happy investing for 2018. Much of my research is published here on Twitter and also archived on my blog at Woobull.com. /31
Fork in the road... LOL. Please continue to next tweet here:

• • •

Missing some Tweet in this thread? You can try to force a refresh
 

Keep Current with Willy Woo

Willy Woo Profile picture

Stay in touch and get notified when new unrolls are available from this author!

Read all threads

This Thread may be Removed Anytime!

PDF

Twitter may remove this content at anytime! Save it as PDF for later use!

Try unrolling a thread yourself!

how to unroll video
  1. Follow @ThreadReaderApp to mention us!

  2. From a Twitter thread mention us with a keyword "unroll"
@threadreaderapp unroll

Practice here first or read more on our help page!

More from @woonomic

Sep 25, 2018
Outstanding talk by @nic__carter at @hodlhodl's #hb2018.

Some highlights... Quoted text are from Nic's talk, the rest is my commentary.

"Container ships, not parcels."

"Bitcoin - $3k avg transaction"

Credit cards (2012 figures):
Visa - $91
Mastercard - $92
Amex - $150
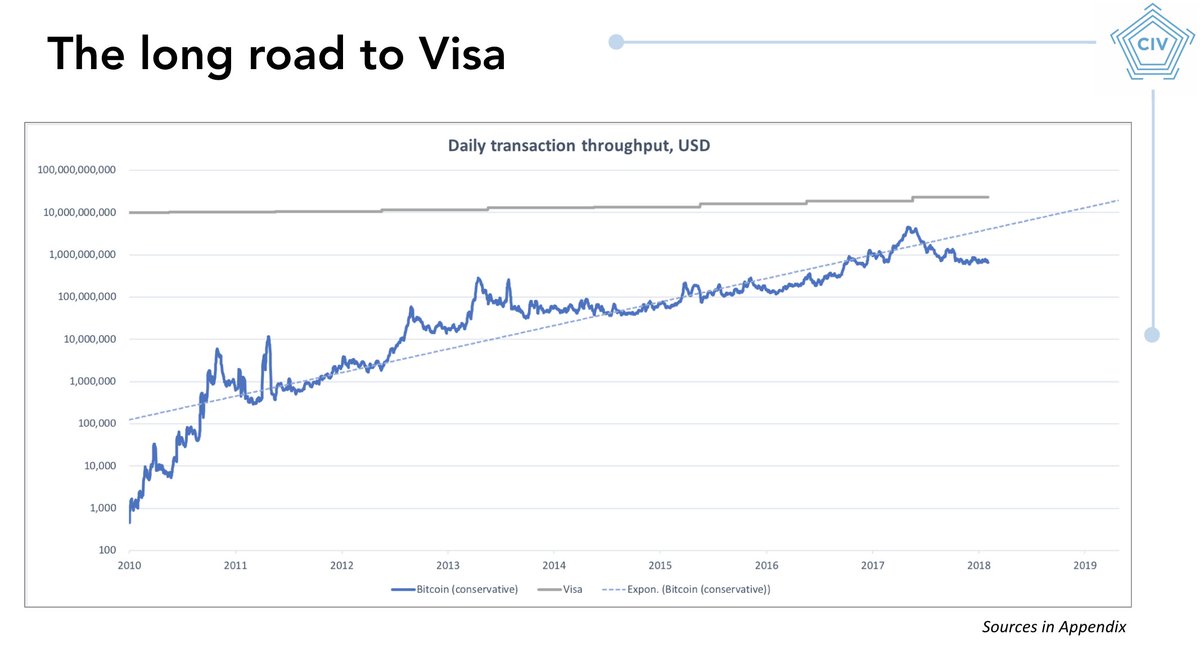
"We are within an order of magnitude away from Visanet throughput."

@blockchain's estimates are shown here, which I agree are conservative. I would guess we are within 3 years away for exceeding Visanet volume throughput.
"Bitcoin volumes in context"

"Bitcoin just recently surpassed Gold OTC settlement markets"

One of these lines is not like the others :). Bitcoin is still in its earlier stage of the adoption S-curve. Best estimates is 1%-3% of world population.
Read 12 tweets
Sep 17, 2018
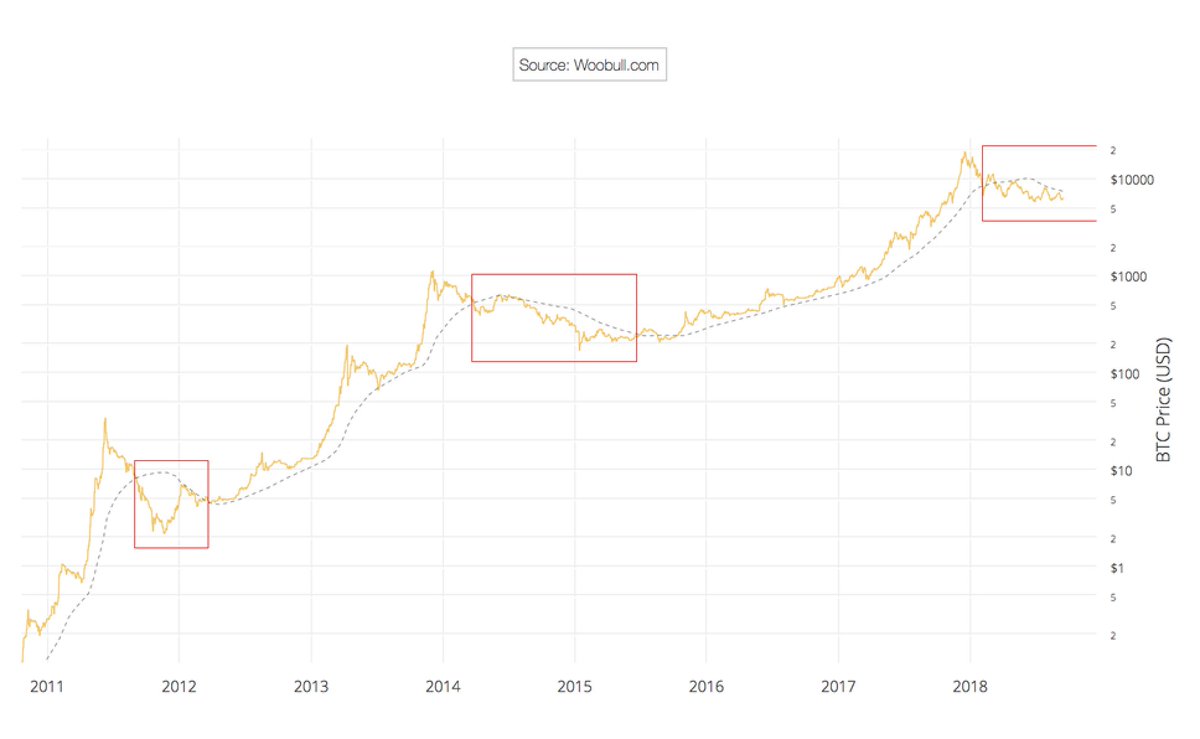
Bitcoin has seen only 3 bear markets in its history**. We are in the third one now. One signal we can use to determine the end of the bear is for the price to cross above its 200 day moving average.

(** this is a big discussion in itself)
Let's check my fav long range indicator... NVT Ratio.

NVT peaks during bear markets, it's been criticised for being laggy in detecting bears, however it is a LEADING indicator to signal the end of the bear.

NVT returns to it's normal range BEFORE the next accumulation phase.
Under NVT we are in the middle of the bear.

In the 2014 bear, there was this zone where volatility dropped to levels suggesting accumulation had begun. We thought the bottom was in.
Read 9 tweets
Jul 27, 2018
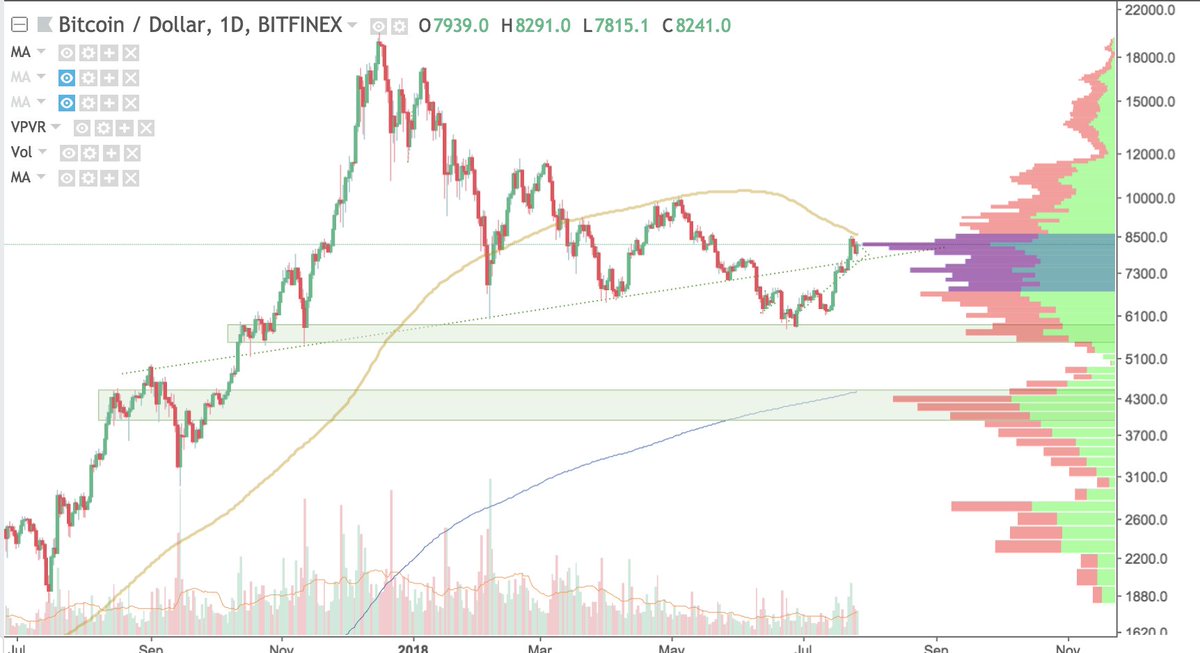
Sentiment is bullish, but I doubt we'll break $8.5k volume profile PoC & 200MA. I think sideways, then downwards over the coming weeks to complete the third dead kitten, sliding downwards until a sustained sideways period to normalise volatility and NVT and a bull setup for 2019.
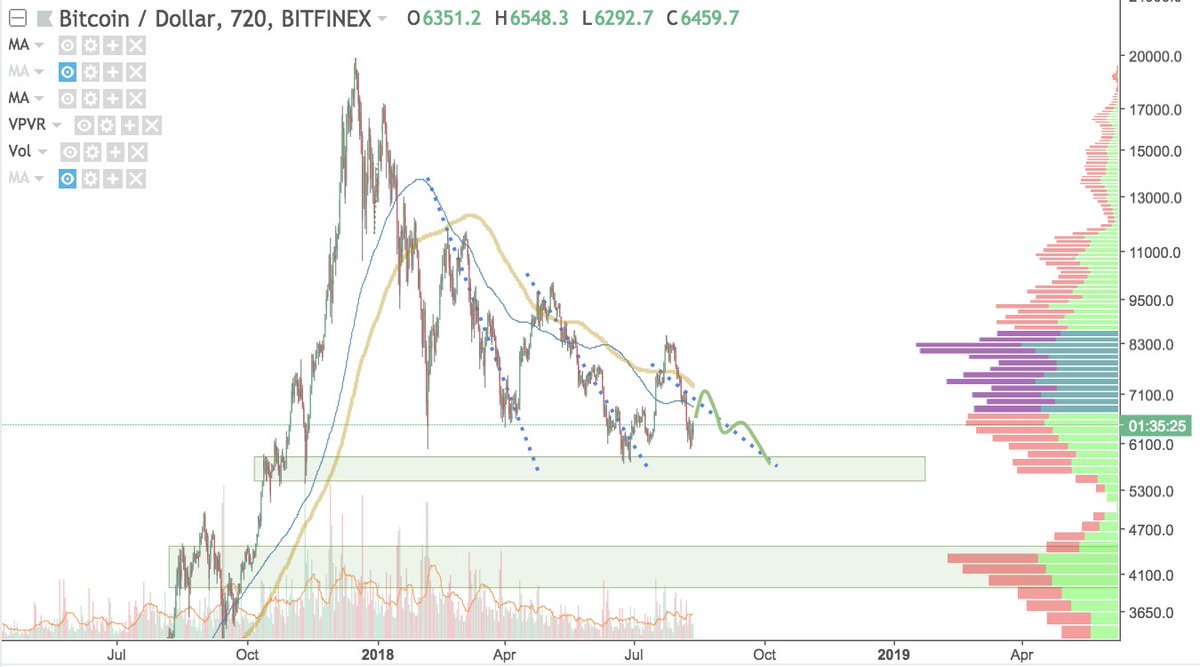
The 3rd dead kitten. Fractally speaking, I'm framing this last down leg as an oscillation around the main move. The green line is just magic crayons for short range TAs to determine, the retest target and rate of decline are the things I'm watching. NVT only mildly supports this.
Leveraged short positions now near all time high. Anyone got a spare $35m in their trade account? Should be enough to trigger all those stops for a payday.

See 12th April 2018. (Be care shorting out there.)
Read 9 tweets
May 31, 2018
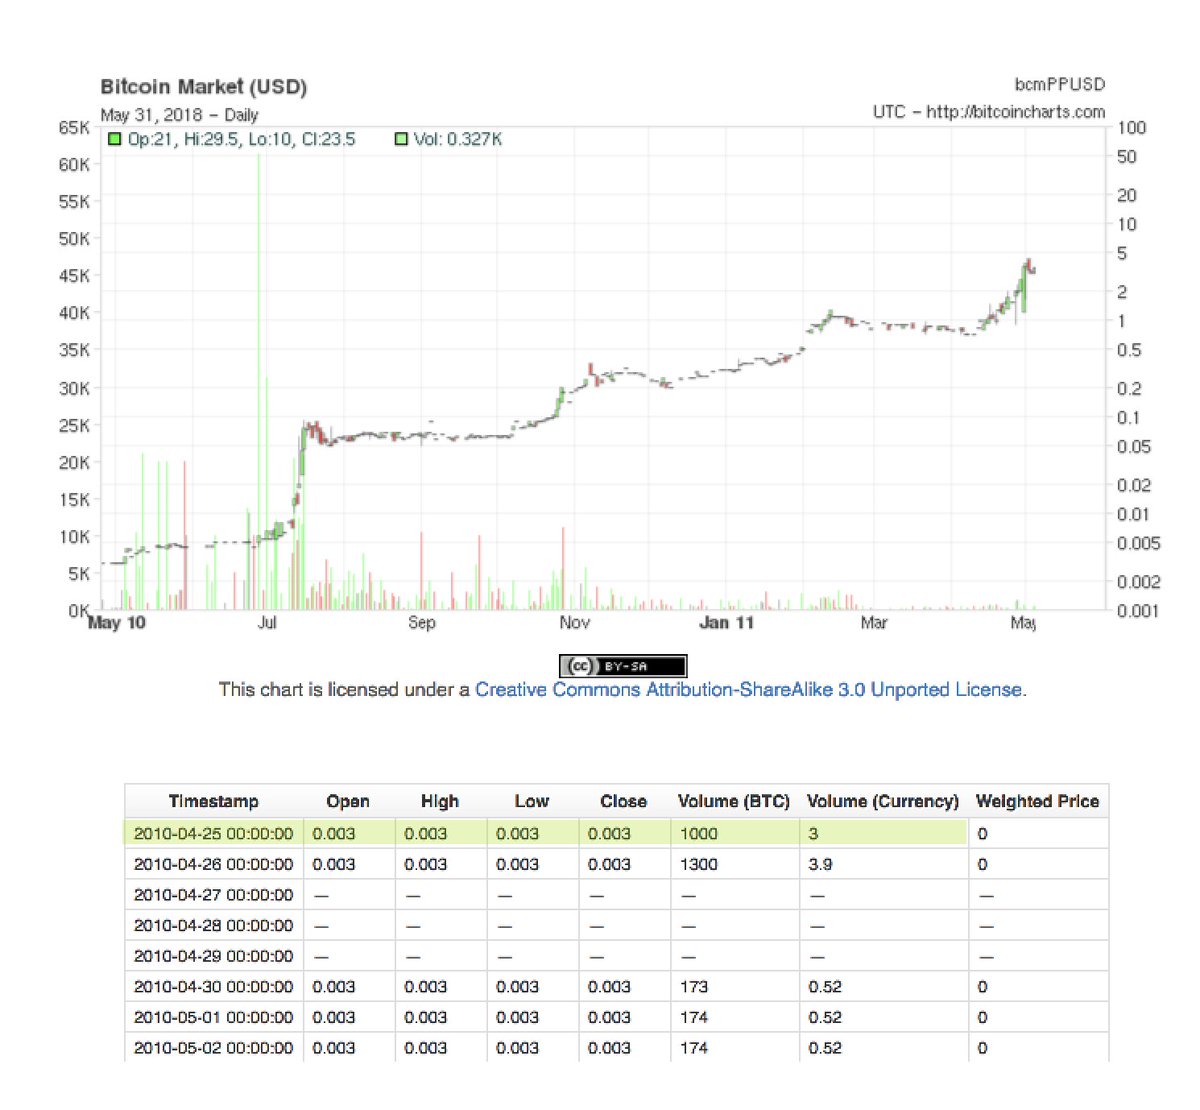
A trip down memory lane... The earliest #bitcoin price chart I've found is from bitcoincharts.com of "Bitcoin Market". This was pre-MtGox. On May 25, 2010 #Bitcoin was trading at 0.3 cents. 1000 BTC was traded that day, for a 24hr volume of $3 USD. @cryptotwitter
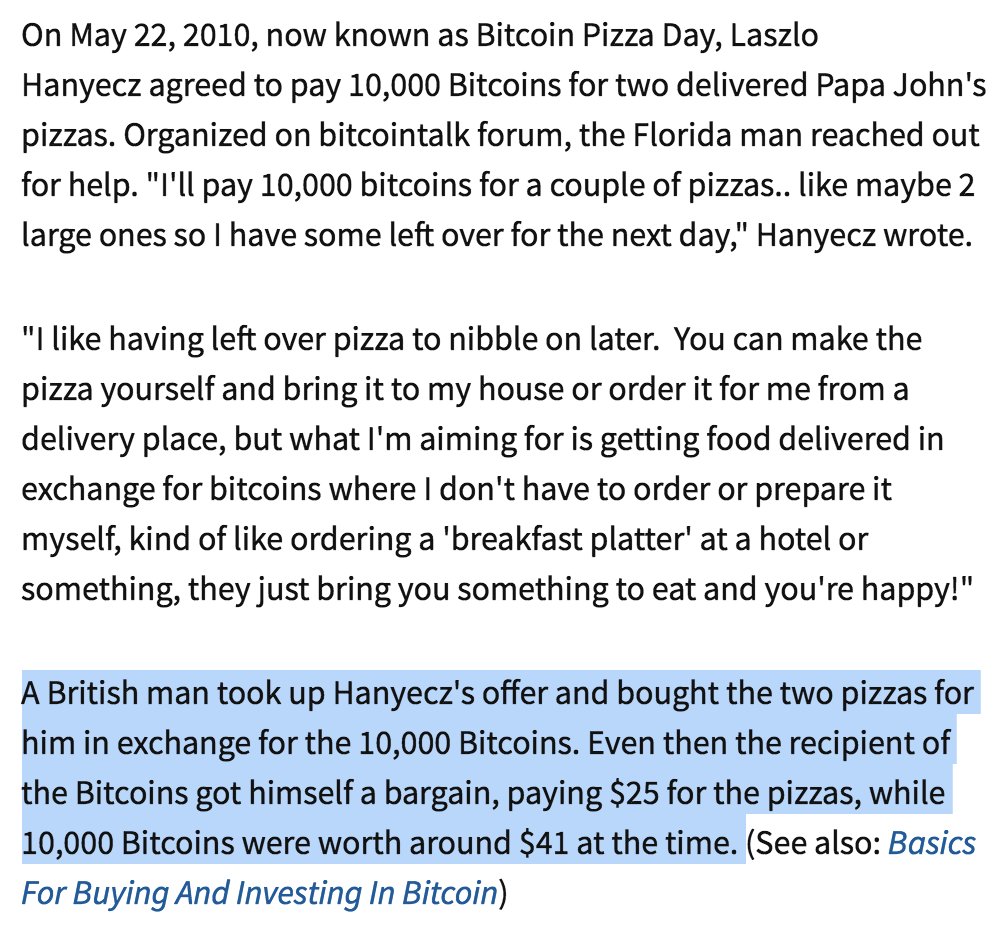
The famous Bitcoin Pizza Day was only 3 days earlier on 22 May 2010 when Laszlo Hanyecz paid 10,000 BTC for two Papa John's pizzas. 0.25 cents per BTC. Apparently the market rate was 0.41 cents per BTC. (via @Investopedia)
During 2010, pre Mt Gox, alongside BitcoinMarket.com, there was also The Bitcoin Exchange in operation. I'd love to see their price data to reconstruct the full price chart 2009-2018, if anyone has it.
Read 6 tweets
May 26, 2018
I think we are gonna go to $5500-5700 next, I can't see $7000 holding. Most likely we'll balance a bit, then we'll slide through. Long timeframes here, looking into June for rough timing of this to play out at a best guess. /1
1) NVT Signal is still too high. We need more blockchain transactional activity to justify the current price, or the price to drop to reconcile the difference. To drive up transactional activity in a bear slide is very unlikely IMO. /2
2) Volatility is still too high. I'm looking for a sustained low band of volatility which tends to be a signal for the end of the detox and the next accumulation phase. It's still got some time to ride down. /3
Read 12 tweets
May 23, 2018
Interesting to see @PeterLBrandt is calling for a 65% chance wedge support support failing and a bottom of $3505 based on TA models. This would be inline with the peak to trough retrace we had in the 2013->2015 bear market. /1
The question to ask is whether we can unwind from Dec 2017's mania in the $6k-$7k range, or that fails and we're forced to consolidate lower like in 2014. This was the moment of truth in 2014. When support broke and we were forced to unwind at the lower levels... /2
But in 2018 I see none of the weakness of 2014. Those down-whiskers in 2014 were pretty tragic, buyers were weak. Here in 2018 the whiskers are very muted. There's lots of liquidity holding this thing up. /4
Read 6 tweets

Did Thread Reader help you today?

Support us! We are indie developers!


This site is made by just two indie developers on a laptop doing marketing, support and development! Read more about the story.

Become a Premium Member ($3/month or $30/year) and get exclusive features!

Become Premium

Don't want to be a Premium member but still want to support us?

Make a small donation by buying us coffee ($5) or help with server cost ($10)

Donate via Paypal

Or Donate anonymously using crypto!

Ethereum

0xfe58350B80634f60Fa6Dc149a72b4DFbc17D341E copy

Bitcoin

3ATGMxNzCUFzxpMCHL5sWSt4DVtS8UqXpi copy

Thank you for your support!

Follow Us on Twitter!

:(