If you want to kill people, the most effective way to do this in the modern era (since gun laws and annoying people like the Police will make things awkward) is to persuade people to stop (or never start) a statin.
Over the long term, 1 in 10 will be killed by that choice.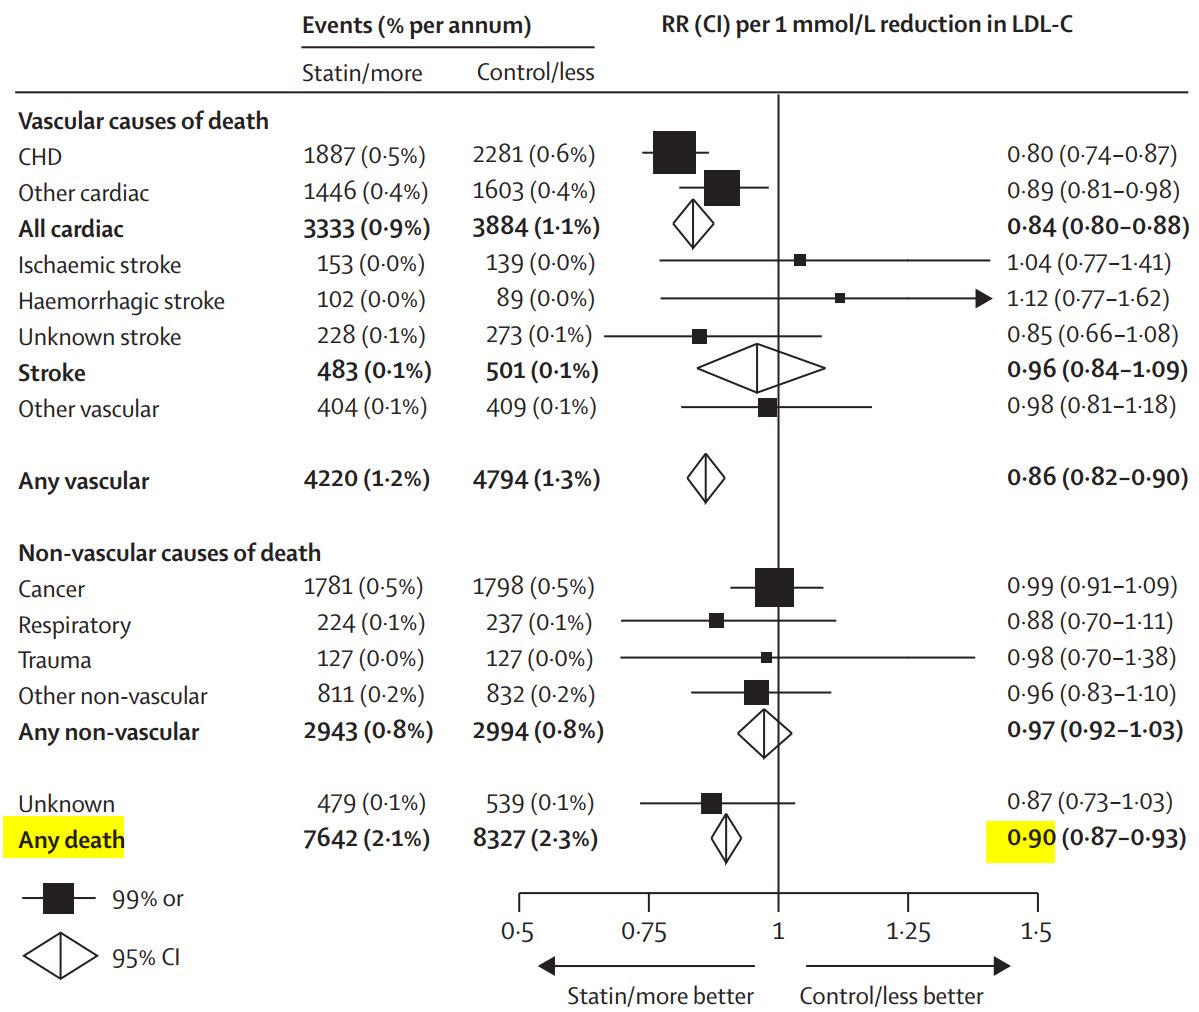
Over the long term, 1 in 10 will be killed by that choice.
You can even write books about it and make money.
And be seen as a crusader against a crooked medicogovernmental conspiracy.
The internet is a good place to operate, because most lay people can't distinguish scientific reasoning from pseudoscience, and because ...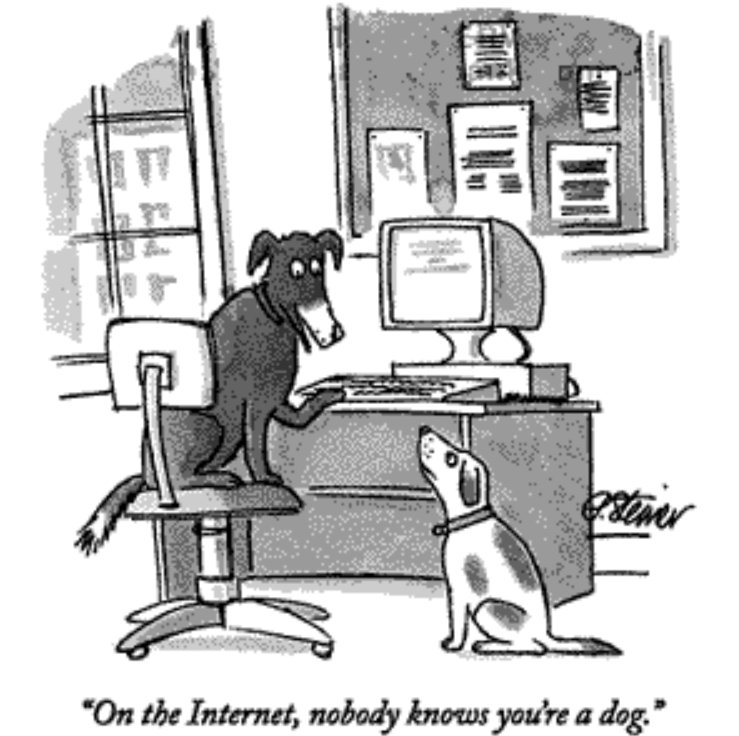
And be seen as a crusader against a crooked medicogovernmental conspiracy.
The internet is a good place to operate, because most lay people can't distinguish scientific reasoning from pseudoscience, and because ...
Excellent question from Arnab: 
There is no RCT or meta analysis that finds any LOW RISK patient group in whom statins have a statistically significantly different effect on all cause mortality than shown above.
There are HIGH risk groups, e.g. those imminently dying of cancer, heart failure, renal failure, or old age, where the hazard ratio may be significantly worse (i.e. closer to 1) than 0.90, but no LOW risk groups.
So statin-denial is the best way to kill low risk people.
So statin-denial is the best way to kill low risk people.
Excellent question from Andy now: 
No I wouldn't waste your time with secondary prevention.
Even the statin nitwits generally don't try to deny secondary prevention.
This is all primary prevention.
Try the Finegold meta-analysis of unwanted outcomes, including muscle pains, diabetes and death.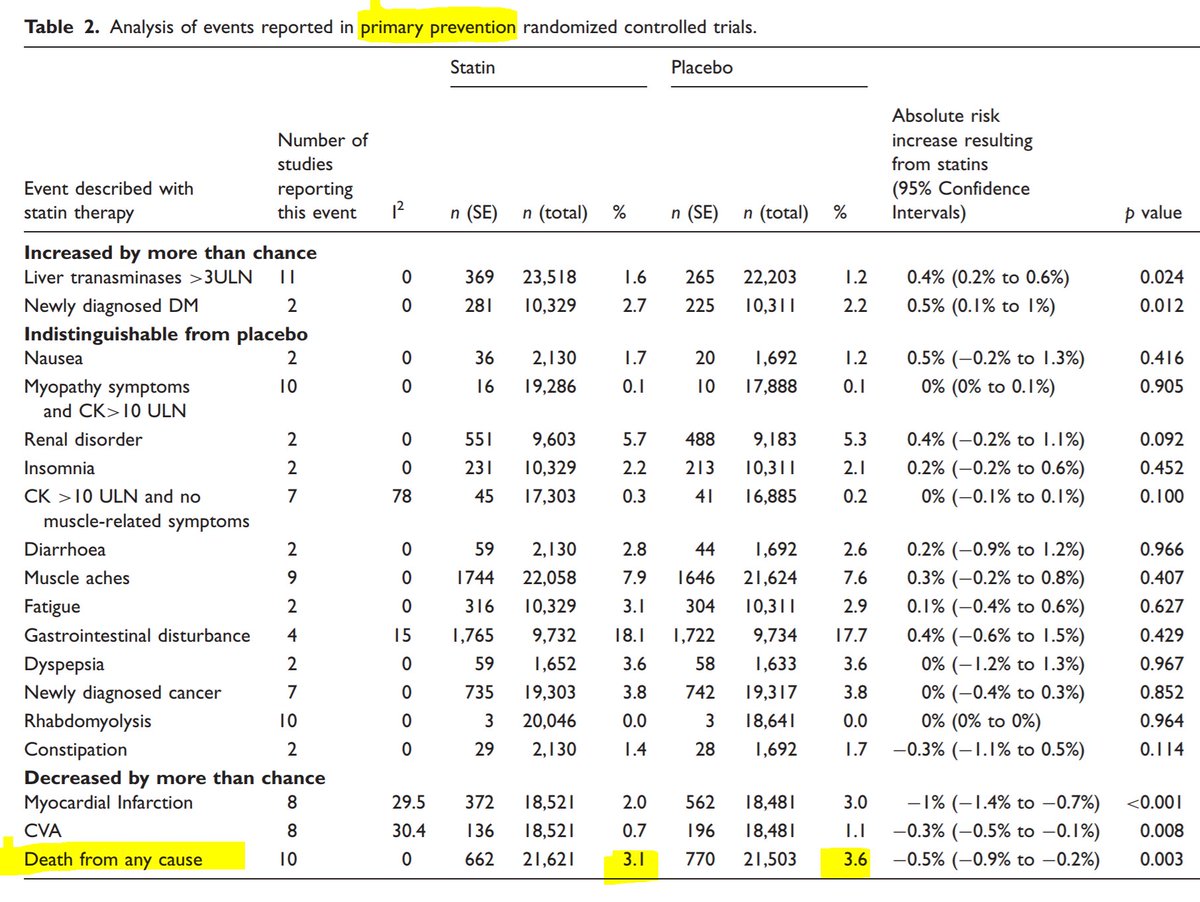
Even the statin nitwits generally don't try to deny secondary prevention.
This is all primary prevention.
Try the Finegold meta-analysis of unwanted outcomes, including muscle pains, diabetes and death.

Doctor the Frog makes a point forcefully: 
Yes indeed. Approximately 90% of people taking statins for primary prevention will live no longer as a result.
Only ~10% will live longer. [They live about 10 years longer on average.]
So if you get 1000 people to choose AGAINST statins, how many people will live shorter lives?
Only ~10% will live longer. [They live about 10 years longer on average.]
So if you get 1000 people to choose AGAINST statins, how many people will live shorter lives?
Excellent question from Tony.
It is REALLY good for people to look at the data and demand answers like this.
Much better than reading hysterical hype.
It is REALLY good for people to look at the data and demand answers like this.
Much better than reading hysterical hype.
Suppose you had a 1000 people in placebo arm and 1000 people in statin arm.
When the trial ended, 2.3% died in the placebo arm and 2.1% in the statin arm.
How many actual people died?
When the trial ended, 2.3% died in the placebo arm and 2.1% in the statin arm.
How many actual people died?
First 4 votes correct! Yay
So how many deaths have you prevented?
So how many deaths have you prevented?
But wait, the survival curves looked like this.
At what time point have we been reading the numbers off?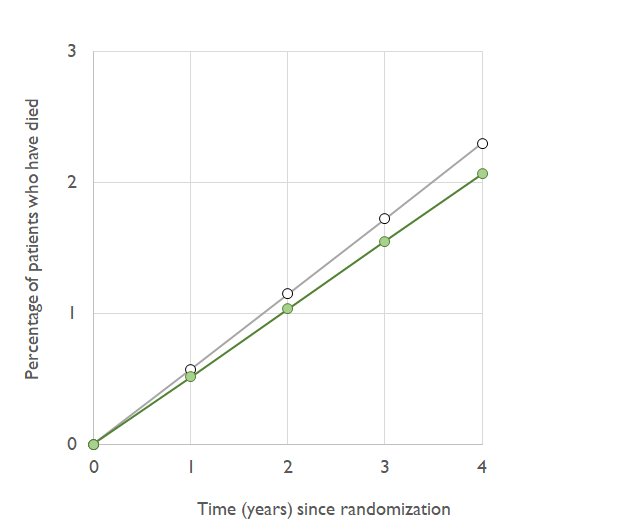
At what time point have we been reading the numbers off?
At what time point is the green statin curve at 2.1% mortality and the grey placebo curve at 2.3% mortality?
Using the graph, or (if you don't like graphs) using your common sense that the deaths accumulate at a steady rate, if we had done our calcs at TWO years instead of 4,
How many were dead be in the Placebo and the Statin arms?
[Let's imagine we can have fractional people!]
How many were dead be in the Placebo and the Statin arms?
[Let's imagine we can have fractional people!]
So, at the 2 year time point, how many lives have we saved (out of the 1000 that we started with) by being on a statin?
I borrowed $1000 ten years ago on a credit card. I didn't pay it back.
The next year, I owed them more, $1200.
The year after, I owed them even more, $1430.
I shut my eyes. I hoped the debt would go way, or at least stop rising, by my act of not looking.
How much do I owe now?
The next year, I owed them more, $1200.
The year after, I owed them even more, $1430.
I shut my eyes. I hoped the debt would go way, or at least stop rising, by my act of not looking.
How much do I owe now?
If a thing is growing with time for whatever period of time you look at it, is it safe to assume it stops growing when you look away?
"If a bank is charging you interest, even if there is nobody reading the bills, does it increase the debt?" #philosophy!
"If a bank is charging you interest, even if there is nobody reading the bills, does it increase the debt?" #philosophy!
Back to statins and not my financial irresponsibility!
Starting a lifelong course of statins on the 1000 patients saves how many lives? What is the right answer?
Starting a lifelong course of statins on the 1000 patients saves how many lives? What is the right answer?
If you continued the trial for longer than 4 years, let's guess what would happen.
ASSUMING things went on the same trajectory, if you doubled the duration, how many do you think will have died at 8 years (twice as long as the point of 23 + 21 )
ASSUMING things went on the same trajectory, if you doubled the duration, how many do you think will have died at 8 years (twice as long as the point of 23 + 21 )
Based on the commonest answer above, how many deaths have been prevented at 8 years, amongst the 1000 statin treated patients?
Excellent. We can calculate this at any time point.
Within the duration of the trial, we can calculate it from real data.
After the trial ends, people are free to do whatever they want (i.e. statin or not) and we are not formally tracking their outcomes, so it is extrapolation.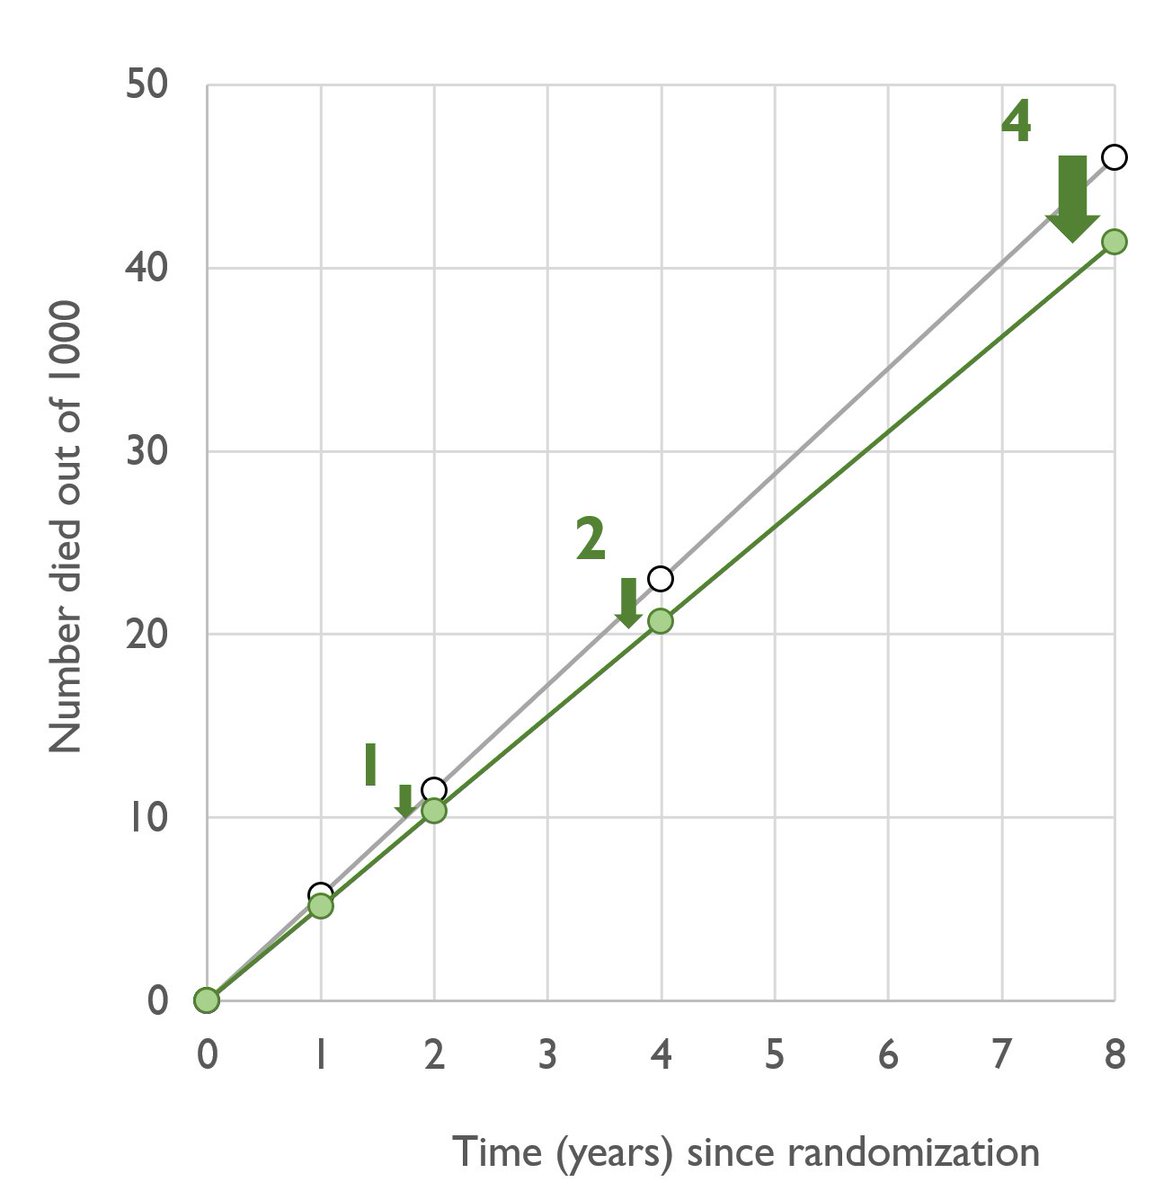
Within the duration of the trial, we can calculate it from real data.
After the trial ends, people are free to do whatever they want (i.e. statin or not) and we are not formally tracking their outcomes, so it is extrapolation.
Do you intend to die within the next 4 years?
If you have advanced cancer and are very likely to die within the next 4 years, then the "2 out of 1000" figure is right for you.
If you don't, you are like most people. You realise you will die at some stage, but hopefully 10, 20, 30, 40 or more years in the future.
If you don't, you are like most people. You realise you will die at some stage, but hopefully 10, 20, 30, 40 or more years in the future.
That is longer than any trial of statins. So our reasoning for recommending statins is that there continues to be a lower mortality over the long term.
Have a look at ASCOT-LLA. In this trial patients had randomized statin for 3.3 years. But the trial reassessed survival at ~11y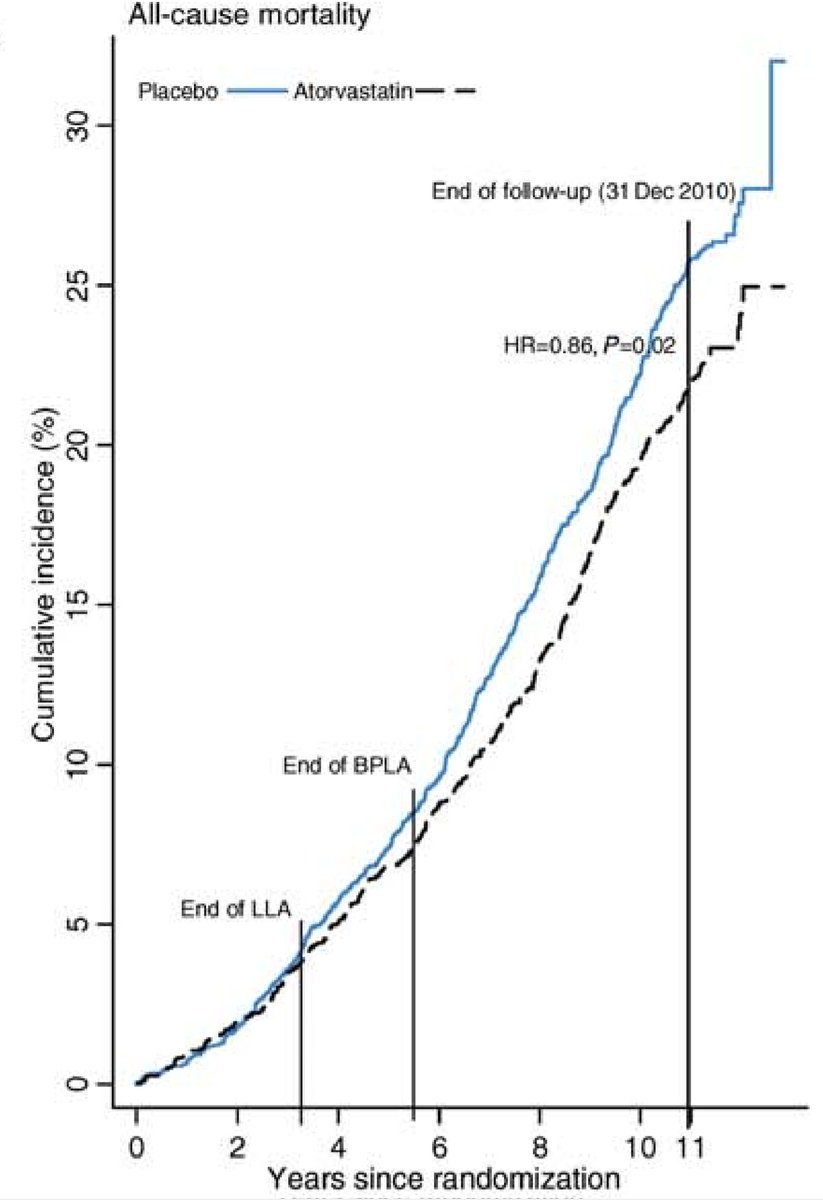
Have a look at ASCOT-LLA. In this trial patients had randomized statin for 3.3 years. But the trial reassessed survival at ~11y
In that trial, at the vertical line at 11 yr, what are the cumulative mortalities in the two arms? Placebo and statin.
Does that suggest that the effect of statin on all cause mortality wears off over time?
OK here are the data we have collected so far.
At 0 years, 0/1000 life saved. That's terrible, but it's early days.
At 1 year, 0.5/1000 saved.
At 2 years, 1/1000
At 4 years, 2/1000
At 8 years, 4/1000
We could say "the only right duration is the duration of the trial", 4 years.
At 0 years, 0/1000 life saved. That's terrible, but it's early days.
At 1 year, 0.5/1000 saved.
At 2 years, 1/1000
At 4 years, 2/1000
At 8 years, 4/1000
We could say "the only right duration is the duration of the trial", 4 years.
OK take 4 years, 2/1000 lives saved.
But wait!
CV risk rises 3-fold with every decade of life.
Suppose our trial has mean age 60 y.
A patient aged 70 y has 3x as much risk as the 2.3% and 2.1% of the average patient.
What is his mortality risk at 4 years, in the two arms?
But wait!
CV risk rises 3-fold with every decade of life.
Suppose our trial has mean age 60 y.
A patient aged 70 y has 3x as much risk as the 2.3% and 2.1% of the average patient.
What is his mortality risk at 4 years, in the two arms?
So if we took two groups of 1000 seventy-year olds, like him, randomized to statin v placebo, how many actual people would there be alive extra at 4 years that wouldn't have been, without the statin?
Remember the mortality fell from 6.9% to 6.3%, and there were 1000 in each arm.
Remember the mortality fell from 6.9% to 6.3%, and there were 1000 in each arm.
Note: the 70 year olds had 3 times the risk of the averaege patient, and we saved 6/1000 lives, instead of 2/1000.
How much larger is the number of lives saved amongst 70 year olds (who have 3x the risk) than 60 year olds (who have average risk for the trial)
How much larger is the number of lives saved amongst 70 year olds (who have 3x the risk) than 60 year olds (who have average risk for the trial)
Already we have seen that by varying the "time window" from 0 to 8 years, we can get any number of lives saved we want from 0 to 4/1000.
Now we have seen by STAYING at 4 years, but varying the risk status of the patient, we can also get any number of lives saved from 0 to (at 70 years) 6/1000.
If we went older, or added diabetes, or smoking, we could get it even higher, to almost anything we want.
If we went older, or added diabetes, or smoking, we could get it even higher, to almost anything we want.
It isn't cheating. Each of us is an individual with our own risks. Some of us have diabetes, a family history, a smoking habit. We all have our individual age, BP, diet and exercise habits.
If YOU ran a trial averaging 70 year olds how much larger would you "absolute lives saved" be than my trial of 60 year olds?
Assume the trials were otherwise similar.
Three-fold higher baseline risk, means what-fold ABSOLUTE lives saved?
Assume the trials were otherwise similar.
Three-fold higher baseline risk, means what-fold ABSOLUTE lives saved?
Right, and this is just the "age" lever. We also have all the other risk fators. Even if we use exactly the same protocol, patients will be different between our trials.
And then each individual "end-user" of statins will be different, so the "ABSOLUTE" lives saved will differ.
And then each individual "end-user" of statins will be different, so the "ABSOLUTE" lives saved will differ.
Let's look at all our wall of numbers another way.
Instead of the ABSOLUTE risk reductions in isolation, let's look at the numbers of deaths in each arm, side by side.
Instead of the ABSOLUTE risk reductions in isolation, let's look at the numbers of deaths in each arm, side by side.
When Plac 23 deaths, Statin was 21. Let's write that like this:
23:21 (at 4 y).
So adding the other time points:
11.5:10.5 (at 2y)
46:42 (at 8y)
And at 4 years lets try the 70 year olds
69:63
See anything?
23:21 (at 4 y).
So adding the other time points:
11.5:10.5 (at 2y)
46:42 (at 8y)
And at 4 years lets try the 70 year olds
69:63
See anything?
The ratio between the first pair of numbers is 21/23
What is the ratio between 42 and 46?
What is the ratio between 42 and 46?
Let's think of the 70 year olds.
69 placebo and 63 statin deaths (based on being triple risk in both arms)
What is the ratio?
Statin divided by placebo
69 placebo and 63 statin deaths (based on being triple risk in both arms)
What is the ratio?
Statin divided by placebo
Hopefully you will see that what is common to all the timepoints (in our hypothetical trial) and to all levels of risk, is the RATIO between rates in the statin versus placebo.
We call this the RISK RATIO.
We call this the RISK RATIO.
The RISK RATIO is a summary of the result of the trial. In our case it is
What is the risk ratio for our trial?
Hint in next tweet if you want to do it without a calculator.
What is the risk ratio for our trial?
Hint in next tweet if you want to do it without a calculator.
HINT
All ORBITA-HQ PhD'ers would be expect to get this right to within 5% of the right answer, in a snap.
21/23 is 1 minus 2/23.
2/23 is almost 2/20, or 1/10, which is 0.1. So FIRST APPROXIMATION IS 0.9
All ORBITA-HQ PhD'ers would be expect to get this right to within 5% of the right answer, in a snap.
21/23 is 1 minus 2/23.
2/23 is almost 2/20, or 1/10, which is 0.1. So FIRST APPROXIMATION IS 0.9
If I asked for a better estimate my PhD students would say:
2/23 smaller than 2/20, by about 15%, because 23 is about 15% more than 20.
So don't deduct the "full" 0.1, deduct 15% less, i.e. add on 0.015.
SECOND APPROXIMATION is 0.915.
This is within 2 parts in a 1000 of truth: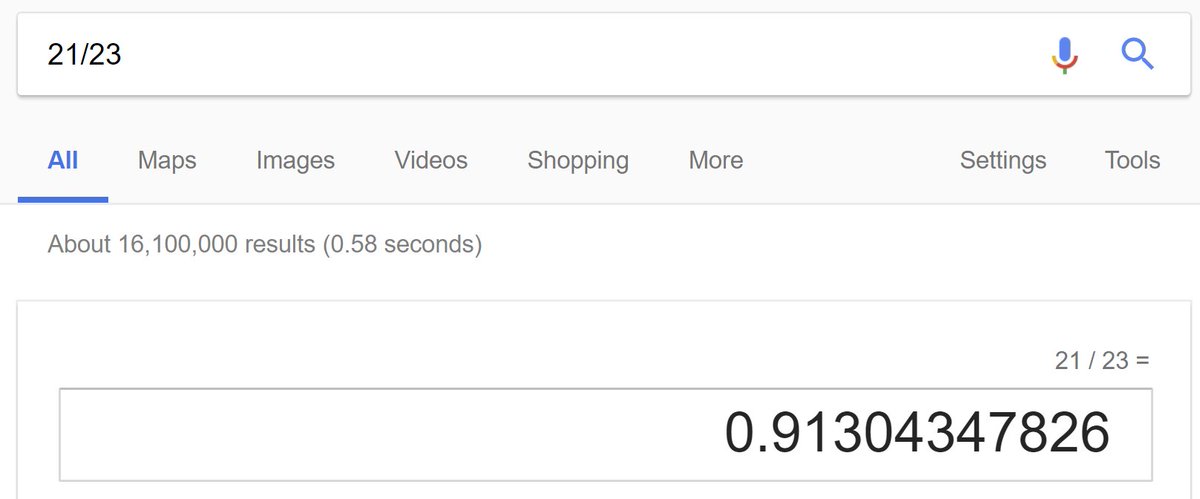
2/23 smaller than 2/20, by about 15%, because 23 is about 15% more than 20.
So don't deduct the "full" 0.1, deduct 15% less, i.e. add on 0.015.
SECOND APPROXIMATION is 0.915.
This is within 2 parts in a 1000 of truth:
I trust the opinions of my experienced ORBITA-HQ PhD students because they are good at deciding what calculations to do, and doing estimates in their head to the necessary precision.
If I wanted to summarise my own trial, of FRANCISOSTATIN, I would say it had a "risk ratio" of 21/23, or 0.91.
Inside it, any patient randomized to statin instead of placebo has only 0.91x as much chance of dying.
Young or old, diabetic or not, the ratio is roughly right.
Inside it, any patient randomized to statin instead of placebo has only 0.91x as much chance of dying.
Young or old, diabetic or not, the ratio is roughly right.
Whether I look earlyish in the trial or late on, or even after the trial ends for a few years, the ratio is always around 0.91.
I could use 0.91 as the principal number to talk about the trial. But it is a funny number. It has decimals, and lower is better. Two awkward features.
I could use 0.91 as the principal number to talk about the trial. But it is a funny number. It has decimals, and lower is better. Two awkward features.
So in practical terms I would describe it as "9% less than 1", or a "9% relative risk reduction".
If you had a treatment that gave a 9% RELATIVE risk reduction, and your baseline risk over the trial duration was 10% in the control arm, what would it be in the active arm?
If you had a treatment that gave a 9% RELATIVE risk reduction, and your baseline risk over the trial duration was 10% in the control arm, what would it be in the active arm?
The use of the relative risk reduction is NOT a deliberate attempt to mislead the public.
It is exactly the same as a "50% off" . That doesn't mean every item is $50 cheaper: only if they started at $100.
In a "50% off" sale how much is an originally $2 item reduced by?
It is exactly the same as a "50% off" . That doesn't mean every item is $50 cheaper: only if they started at $100.
In a "50% off" sale how much is an originally $2 item reduced by?
In a "10% off" sale, how much is an originally $10 item reduced by?
In a "9% off sale", how much is an originally $10 item reduced BY?
And TO what price?
And TO what price?
Sorry this was such an obvious question, but I was trying to help people stuck on the question above, about "what does a 9% relative risk reduction, from a baseline risk of 10%, get you to?" 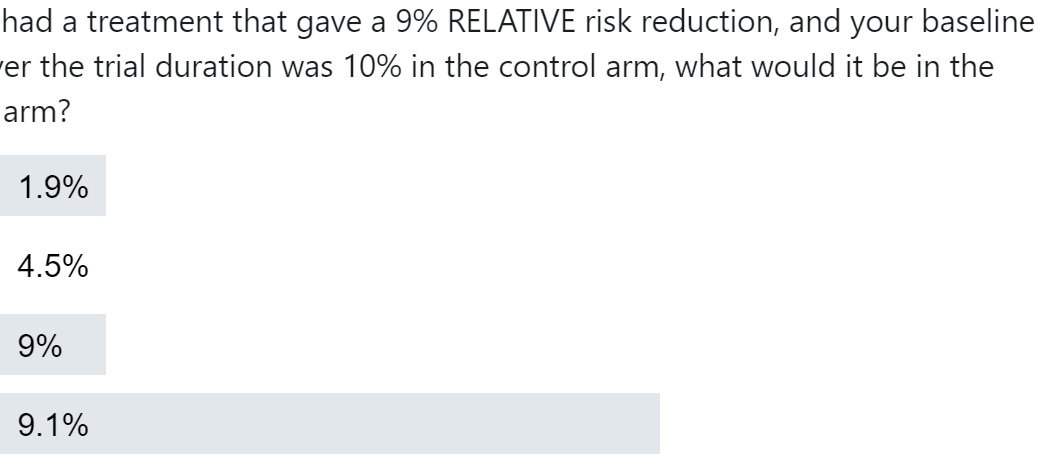
In a shop it is easy to keep things straight, because reductions are in "%" and prices are in "$".
In trials, lay people can get confused, because BOTH the reductions AND the event rates are in "%". I am sorry for your frustration. We clinical scientists have got used to it.
In trials, lay people can get confused, because BOTH the reductions AND the event rates are in "%". I am sorry for your frustration. We clinical scientists have got used to it.
So there are TWO ways of describing the reduction from 2.3% mortality to 2.1% mortality, by Francisostatin in 4 years.
One is "9% RELATIVE RISK REDUCTION"
The other is "0.2% ABSOLUTE RISK REDUCTION"
Both are correct.
One is "9% RELATIVE RISK REDUCTION"
The other is "0.2% ABSOLUTE RISK REDUCTION"
Both are correct.
The relative ("RRR") holds better over different time periods of the trial, and holds better when we look at higher and lower risk patients within the same trial.
In fact CTT 2010 shows this splendid graph which I keep looking at in amazement and happiness.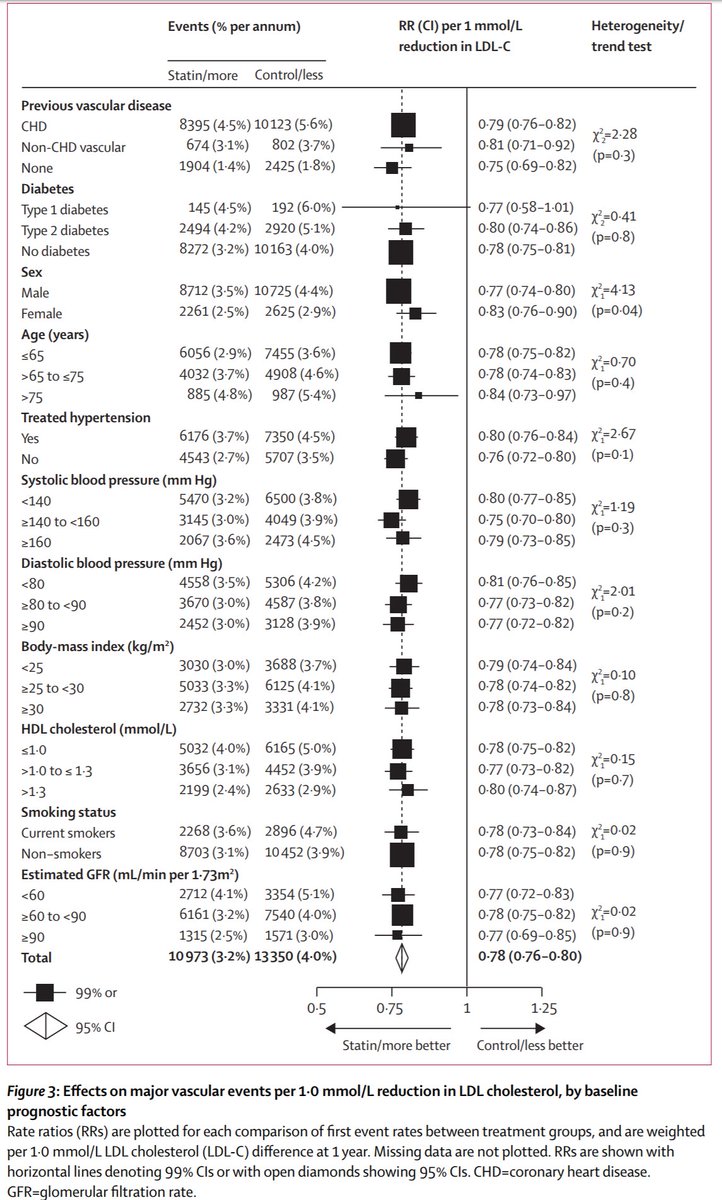
In fact CTT 2010 shows this splendid graph which I keep looking at in amazement and happiness.
I assume everyone instantly understands what it means.
Maybe I am wrong. Let's take a bit of a poll. Be honest.
Maybe I am wrong. Let's take a bit of a poll. Be honest.
OK at 5 votes, only 3 know what it means. So I will detour a little to describe. I hope the others don't mind me teaching grandma to suck eggs.
Let's start at the top left corner.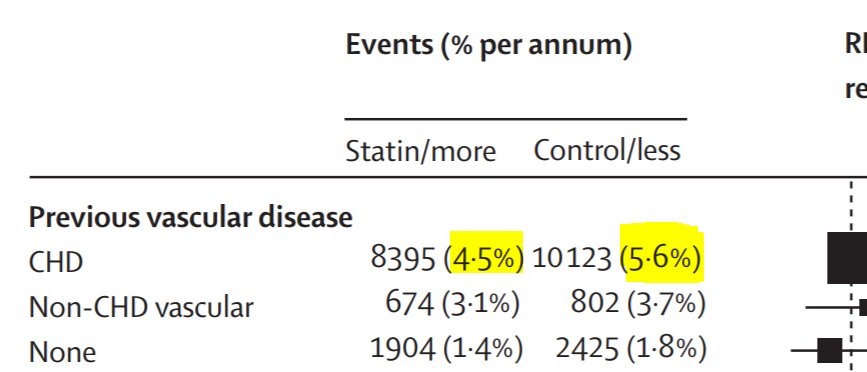
Let's start at the top left corner.
That means that IF YOU ALREADY HAD CHD (coronary heart disease), a form of previous vascular disease, you are in that row. Such patients had a 4.5% risk of Major Vascular Events in the statin arm, and 5.6% in the control.
What is the risk ratio for that, do you think?
What is the risk ratio for that, do you think?
Do you think if we used different samples of patients, it would ALWAYS be exactly that, or might it vary a little?
Of course it varies a bit.
Very clever statisticians of yesteryear worked out how much it varies. It basically depends on how many patients you have in your sample. If you have zillions, you are probably spot on and it won't vary.
But if you have only a few, it could vary a lot.
Very clever statisticians of yesteryear worked out how much it varies. It basically depends on how many patients you have in your sample. If you have zillions, you are probably spot on and it won't vary.
But if you have only a few, it could vary a lot.
That uncertainty is called a confidence interval.
What you calculated was the POINT ESTIMATE (or most likely value), and it has a range of uncertainty around it: the 95% confidence interval.
Zoom out and we see it.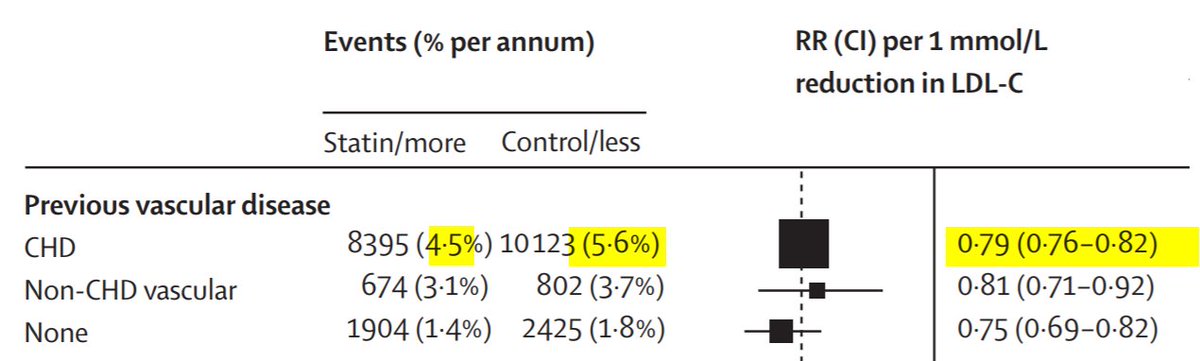
What you calculated was the POINT ESTIMATE (or most likely value), and it has a range of uncertainty around it: the 95% confidence interval.
Zoom out and we see it.
You calculated 0.80, but Prof Sir Rory Collins calculated 0.79.
Why?
Why?
I presently give out atorvastatin 40mg as my "default" statin. This lowers LDL by about 50% (ncbi.nlm.nih.gov/pubmed/9514454) which for a UK person of average LDL 3 mM, is 1.5 mM reduction.
Each trial gave a different strength of statin. The CTT analysis weights them to a common "strength" equivalent to 1 mM LDL reduction.
[When I give out something ~1.5 mM LDL reduction, I expect to get "one and a half" times as good effects as the CTT graph.]
[When I give out something ~1.5 mM LDL reduction, I expect to get "one and a half" times as good effects as the CTT graph.]
So now we know what the top row means.
For people with a background of CHD, there is a 0.79 relative risk (also called a 21% RELATIVE risk reduction) if they take a statin of strength enough to lower LDL by 1 mM.
If you give atorva 40, ~1.5mM redn, what effect might you get?
For people with a background of CHD, there is a 0.79 relative risk (also called a 21% RELATIVE risk reduction) if they take a statin of strength enough to lower LDL by 1 mM.
If you give atorva 40, ~1.5mM redn, what effect might you get?
OK That's the top row.
Let's look at the third row.
People WITHOUT prior coronary heart disease.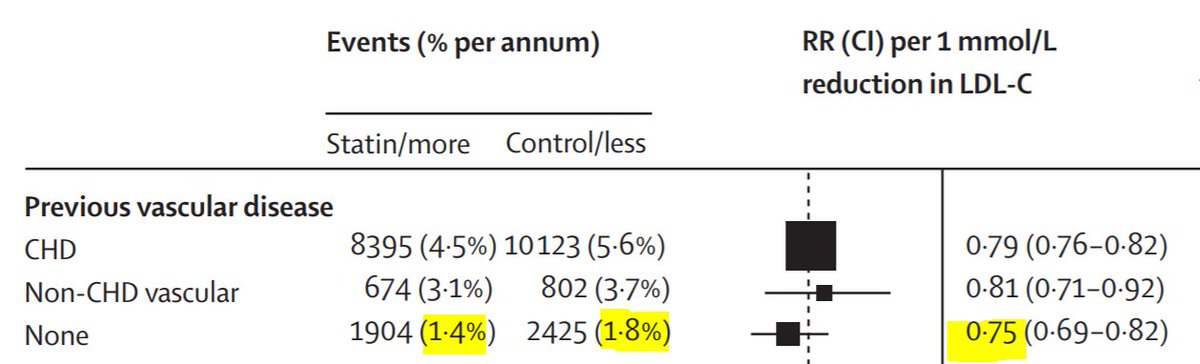
Let's look at the third row.
People WITHOUT prior coronary heart disease.
Two questions about these patients WITHOUT prior coronary heart disease
1. How does their risk (yellow row) compare with the risk of the people who HAVE coronary disease (top row)?
1. How does their risk (yellow row) compare with the risk of the people who HAVE coronary disease (top row)?
2. What is their ABSOLUTE risk reduction in comparison to the people with prior coronary heart disease
Hmmm. First two answers are wrong. I am worried about you people.
Third row. Risk falls from 1.8% to 1.4%, that's an absolute fall of 0.4%.
Top row is 5.6% down to 4.5%, that's an absolute fall of 1.1%.
How does the 3rd row (0.4%) compare against top row (1.1%)
Third row. Risk falls from 1.8% to 1.4%, that's an absolute fall of 0.4%.
Top row is 5.6% down to 4.5%, that's an absolute fall of 1.1%.
How does the 3rd row (0.4%) compare against top row (1.1%)
OK the absolute risk reductions are all different between groups. People who've had a heart attack are more likely to die than those who haven't. So they have more chance of having their lives saved.
But overall, we still prevent the same RELATIVE proportion of deaths: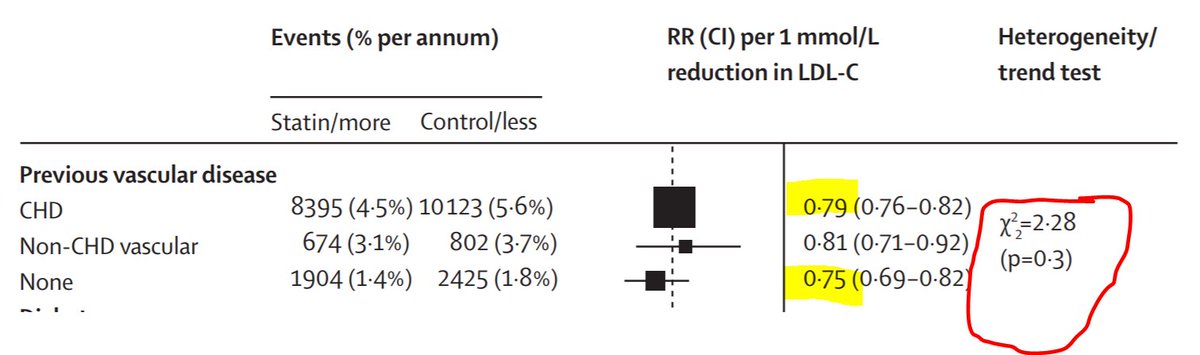
But overall, we still prevent the same RELATIVE proportion of deaths:
The two yellow numbers are roughly the same. They will never be exactly the same. This is real science and not a dodgy dossier.
The funny thing on the right (circled) is a P value telling you whether to get excited about the inevitable difference between the Risk Ratios of the various subgroups (here there is Previous CHD, Previous Other Vascular diease, and No Previous).
P>0.05: don't get excited.
P>0.05: don't get excited.
Now we can do that for every way of slicing the patient. We can slice by presence/absence of hypertension: 
Makes no difference.
.
How about chubbiness?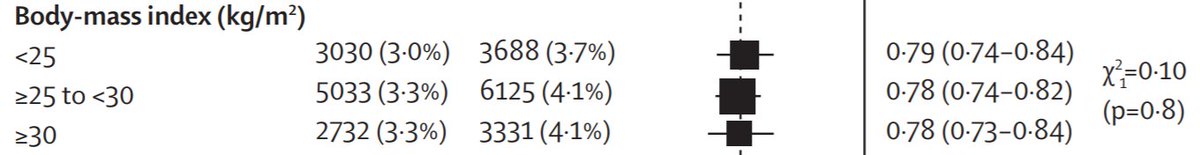
.
How about chubbiness?
That's what I like about this graph from CTT 2010.
It means THERE IS LESS TO KNOW. Thank god.
There is no subgroup that is convincingly different from its counterpart subgroup, in my eyes.
It means THERE IS LESS TO KNOW. Thank god.
There is no subgroup that is convincingly different from its counterpart subgroup, in my eyes.
So I summarise statins as:
ABOUT 20% RELATIVE RISK REDUCTION for a 1 mM-strength statin (I tend to give atorva 40, which is 1.5mM typically, so a 30% RRR)
NO convincing difference between subgroups.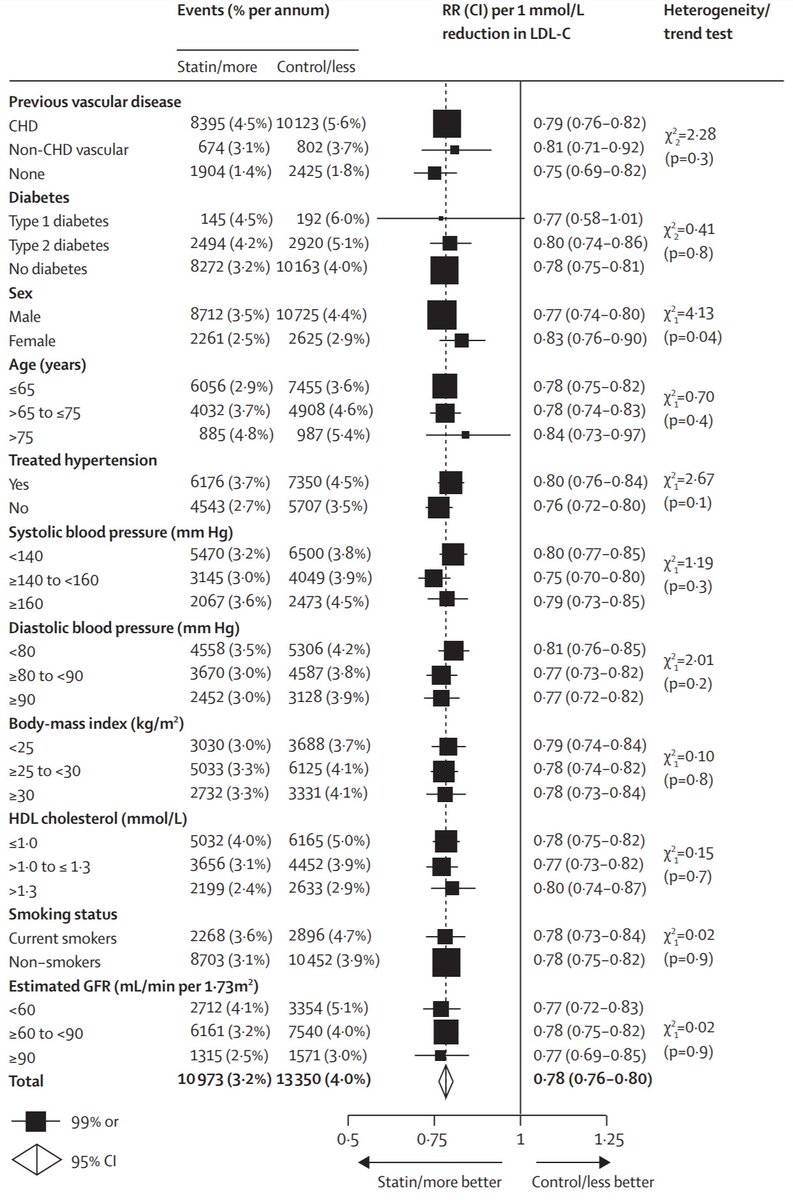
ABOUT 20% RELATIVE RISK REDUCTION for a 1 mM-strength statin (I tend to give atorva 40, which is 1.5mM typically, so a 30% RRR)
NO convincing difference between subgroups.
Now to respond to some complaints:
First from Tom Hyde, who is normally more sensible:
First from Tom Hyde, who is normally more sensible:

Bob has 2 choices. Take a statin or not.
If he chooses no, he has A% mortality.
If he chooses yes, he has 0.9 x A% mortality.
If he WAS GOING to say yes, but you PERSUADE him to say no, his mortality is going from 0.9xA% to A%.
Scale factor is 1.0/0.9 = 1.11.
If he chooses no, he has A% mortality.
If he chooses yes, he has 0.9 x A% mortality.
If he WAS GOING to say yes, but you PERSUADE him to say no, his mortality is going from 0.9xA% to A%.
Scale factor is 1.0/0.9 = 1.11.
For a 1mM-worth statin it is 0.90 hazard ratio.
For a ~1.5mM-worth, it would be a little stronger.
As one ages, the non-cardiovascular forms of death may rise so that it may be weaker.
For a ~1.5mM-worth, it would be a little stronger.
As one ages, the non-cardiovascular forms of death may rise so that it may be weaker.
So I suggest if one starts at (say) 50, then it would be:
* stronger than 0.90 in early decades
* weaker than 0.90 in later decades
Thus I suggest to use 0.90 overall.
However you can use a continuously variable scale as used by Finegold.
openheart.bmj.com/content/3/1/e0…
* stronger than 0.90 in early decades
* weaker than 0.90 in later decades
Thus I suggest to use 0.90 overall.
However you can use a continuously variable scale as used by Finegold.
openheart.bmj.com/content/3/1/e0…
Any questions before I move on to NNT?
I will give an hour
I will give an hour
Hi Aju 
Anyone who wishes to reduce cardiovascular events.
Regardless of LDL, regardless of BP, smoking status, age, etc.
They get approximately (say) 30% reduction in CV events (atorva 40).
Of course stop-smoking, control weight, reduce calories to improve diabtes, BP is important too.
Regardless of LDL, regardless of BP, smoking status, age, etc.
They get approximately (say) 30% reduction in CV events (atorva 40).
Of course stop-smoking, control weight, reduce calories to improve diabtes, BP is important too.
Good question from @NeilQuinn 
Up to the patient.
"Are you interested in taking a tablet that will increase your life expectancy by ~1 year, delivered as follows.
90% chance of getting no increase in lifespan.
10% chance of getting an ~10 year increase."
Of course it is worth eating healthily and exercising
"Are you interested in taking a tablet that will increase your life expectancy by ~1 year, delivered as follows.
90% chance of getting no increase in lifespan.
10% chance of getting an ~10 year increase."
Of course it is worth eating healthily and exercising
Patients vary much more in their preferences, than their lifespan gain calculations for statins.
Strange but true. Fontana et al.
circ.ahajournals.org/content/early/…
Strange but true. Fontana et al.
circ.ahajournals.org/content/early/…
Question from Shaza, thank you 
I believe this to be not possible in any useful way.
We can stratify people a bit in risk, but however apparently good the stratification, the actual survival curves within the stratum start early and end late.
For any stratum, there is very large uncertainty in lifespan.
We can stratify people a bit in risk, but however apparently good the stratification, the actual survival curves within the stratum start early and end late.
For any stratum, there is very large uncertainty in lifespan.
Good comment from Benjamin Fairfax 
Yes you are right for a typical number of cigs/d.
They are only similar in the direction of their effect on mortality, and the fact that you don't have to touch people to kill them: it all works through change in behaviour.
But a very small smoking habit might match anti-statin
They are only similar in the direction of their effect on mortality, and the fact that you don't have to touch people to kill them: it all works through change in behaviour.
But a very small smoking habit might match anti-statin
Great question from Tony Breu.
Asked 13 hours ago, before the explanation of absolute versus relative.
Asked 13 hours ago, before the explanation of absolute versus relative.
Have I adequately answered Tony's question in the tweetorial so far?
i.e. that the RELATIVE risk reduction is ~10%
But the ABSOLUTE risk reduction is ~0.2%.
RRR = ARR divided by control arm risk: 0.2%/2.3% is about 10%.
i.e. that the RELATIVE risk reduction is ~10%
But the ABSOLUTE risk reduction is ~0.2%.
RRR = ARR divided by control arm risk: 0.2%/2.3% is about 10%.
Another excellent question from Tony 
Think about it this way.
Start with a deck of 200 cards. Every year, you shuffle and draw a card. If it is "the card of death", you die. If not, you live and discard the card.
Start with a deck of 200 cards. Every year, you shuffle and draw a card. If it is "the card of death", you die. If not, you live and discard the card.
As you get older, the chance of getting the Death card gets higher, due to there being fewer cards in the deck. It is very likely you will die before the cards run out.
Francis industries offers you a deal.
If you pay us $0.03 per year, any time you draw the death card, we will give you a CHANCE to ignore it.
If you pay us $0.03 per year, any time you draw the death card, we will give you a CHANCE to ignore it.
We will throw a 10-sided die. If it comes up "10", you escape death (and we put the death card back in the pack)
If it comes up 1 to 9, sorry you still die.
(What do you expect for $0.03?)
If it comes up 1 to 9, sorry you still die.
(What do you expect for $0.03?)
We are at a certain year in the game. You have to draw a card. Suppose the probability of it being the death card is D%.
If you have paid Francis Industries your ~$10 per year, what is the probability of dying that year? Remember we cancel 1 in 10 death cards.
If you have paid Francis Industries your ~$10 per year, what is the probability of dying that year? Remember we cancel 1 in 10 death cards.
Sorry the infallible Francis Industries has made a small mistake in the advertisement. Should say $0.03 per DAY. ~$10 per YEAR.
Imagine 1000 patients playing Game of Death WITHOUT having the wisdom and foresight to buy into the Francis Industries "Partial Prevention of Death" program.
Eventually everyone will die.
Eventually everyone will die.
Now imagine a second 1000 patient, this time, investing the $10 a year (that they would otherwise spend on books about eating like a cave man, an orang-utan, or an amoeba) in the Francis industries "we prevent 10% of all deaths" program.
There is a SLIGHT relative reduction in the chance of dying each year. At first it is imperceptible.
Twenty-somethings complain at nightclubs, "This is sh!t. I've never met anyone who drew a death card. And yet I am paying these scamsters $10 a year".
Twenty-somethings complain at nightclubs, "This is sh!t. I've never met anyone who drew a death card. And yet I am paying these scamsters $10 a year".
In their 40s, people start to have friends-of-friends who drew a death card, and were sent away to be vapourised in Carousel. Only vague rumours of anyone actually been saved by Francis industries.
By the 70s though. quite a few people have been offed by their Death Card. And everyone has met someone who got out of it by a Francis Industries "Get Out Of Death Free" roll of the die.
Those people who escape death by that means, don't escape it forever.
Those people who escape death by that means, don't escape it forever.
They will draw the Death Card again sometime, and most often the "Get Out Of Death Free" roll of the die will not work for them. 9/10 times they still die.
So EVENTUALLY everyone dies in the "prevention" and "no prevention" arms.
My customers do JUST A LITTLE BIT better.
So EVENTUALLY everyone dies in the "prevention" and "no prevention" arms.
My customers do JUST A LITTLE BIT better.
Sorry, very long sequence of tweets to explain that this hypothesis of (say) a 0.90 hazard ratio doesn't mean immortality for some. It just means some people escape a death they would otherwise have had, but of course they do die in the end.
I am so glad people are interested in the detail of this.
James Howard and I argued over whether to do the computation in R (his preference because he is trendy) or Matlab (mine, because I am a dinosaur).
So we did it in both languages!
We showed everything openly in our paper
James Howard and I argued over whether to do the computation in R (his preference because he is trendy) or Matlab (mine, because I am a dinosaur).
So we did it in both languages!
We showed everything openly in our paper
Our paper is here.
openheart.bmj.com/content/3/1/e0…
The full code in both languages is in Supplementary Appendix
openheart.bmj.com/content/openhr…
openheart.bmj.com/content/3/1/e0…
The full code in both languages is in Supplementary Appendix
openheart.bmj.com/content/openhr…
Obviously we didn't use a 1-in-10 prevention throughout. It depends on CV and non-CV risk.
The software can be set to address any risk stratum.
If you know Matlab (or Octave) or R, or can read the fairly simple code and put into a language of your choice, go ahead and play.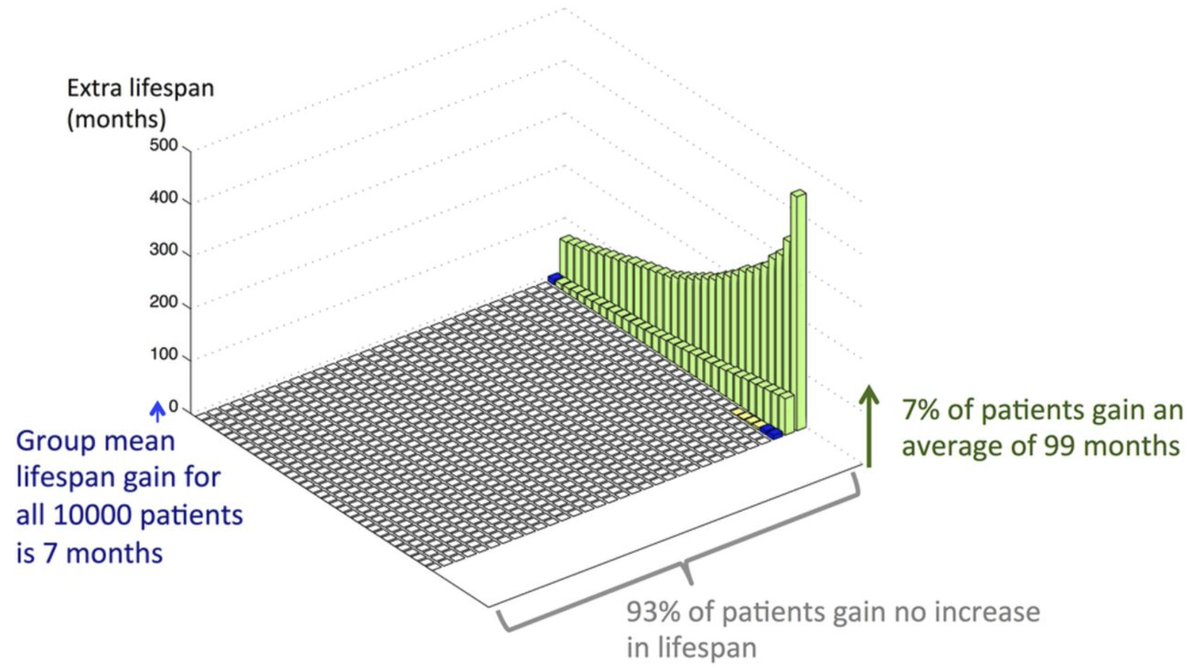
The software can be set to address any risk stratum.
If you know Matlab (or Octave) or R, or can read the fairly simple code and put into a language of your choice, go ahead and play.
It startled us at first that ~90% of people get no lifespan benefit. But that was because we were stupid. If the intervention works by, when you would otherwise die, you throw dice, and have a 1 in 10 chance of getting out of dying, WHAT PROPORTION of deaths get cancelled?
If 9/10 people, when they draw the death card, die anyway (because the Francis Industries get-out-of-death scheme fails to save them) then THEY DO NOT GAIN lifespan.
Let me say that again. 9/10 people die on the same day they were going to die anyway.
They gain nothing.
Let me say that again. 9/10 people die on the same day they were going to die anyway.
They gain nothing.
HOWEVER, the average lifespan gain we calculate for the overall group is still correct (at, very roughly, 1 year)
How can this be?
How can 90% of people gain nothing, but the overall group gain an average of 1 year?
How can this be?
How can 90% of people gain nothing, but the overall group gain an average of 1 year?
I have rounded all figures to 1's, 10's etc, in this tweet thread, but read the paper, download the free code and have a play to adjust the nuances to your liking.
Pause for questions before we move on to NNT. 2 hours.
Pause for questions before we move on to NNT. 2 hours.
Excellent questions from Amanda ZZ 
Question 1.
I am not sure where your figures came from. They are not correct.
Very roughly if you start 1000 average 40 year old men on a preventative therapy that prevents 1/10 of all fatal events (think of it as a partially effective bullet proof vest),
I am not sure where your figures came from. They are not correct.
Very roughly if you start 1000 average 40 year old men on a preventative therapy that prevents 1/10 of all fatal events (think of it as a partially effective bullet proof vest),
... then when you continue over a lifetime, about 9/10 will STILL die on the same day that they would have done without the vest.
Is this obvious?
Is this obvious?
This turns out to be the situation with statins. About 9/10 deaths occur anyway.
Either they were non-cardiac (approx 700 of the 1000) or were cardiac but weren't prevented by the statin (200 of the 100).
That leaves 100 deaths that were "prevented".
Either they were non-cardiac (approx 700 of the 1000) or were cardiac but weren't prevented by the statin (200 of the 100).
That leaves 100 deaths that were "prevented".
Obviously those 100 people will still die, just on another day, a bit later.
How much later? The calculation shows you. On average VERY ROUGHLY 10 years later.
So overall the lifespan extension is about 1 year averaged over all 1000 people.
900 get nothing.
100 get 10y.
How much later? The calculation shows you. On average VERY ROUGHLY 10 years later.
So overall the lifespan extension is about 1 year averaged over all 1000 people.
900 get nothing.
100 get 10y.
Second question from Amanda
"Can we work out who is going to be one of the ones who gets lifespan extension, and who doesn't, so we can just treat them and save annoying everyone else?"
YES! We do this by running RCTs of statin and see who has the best hazard ratio.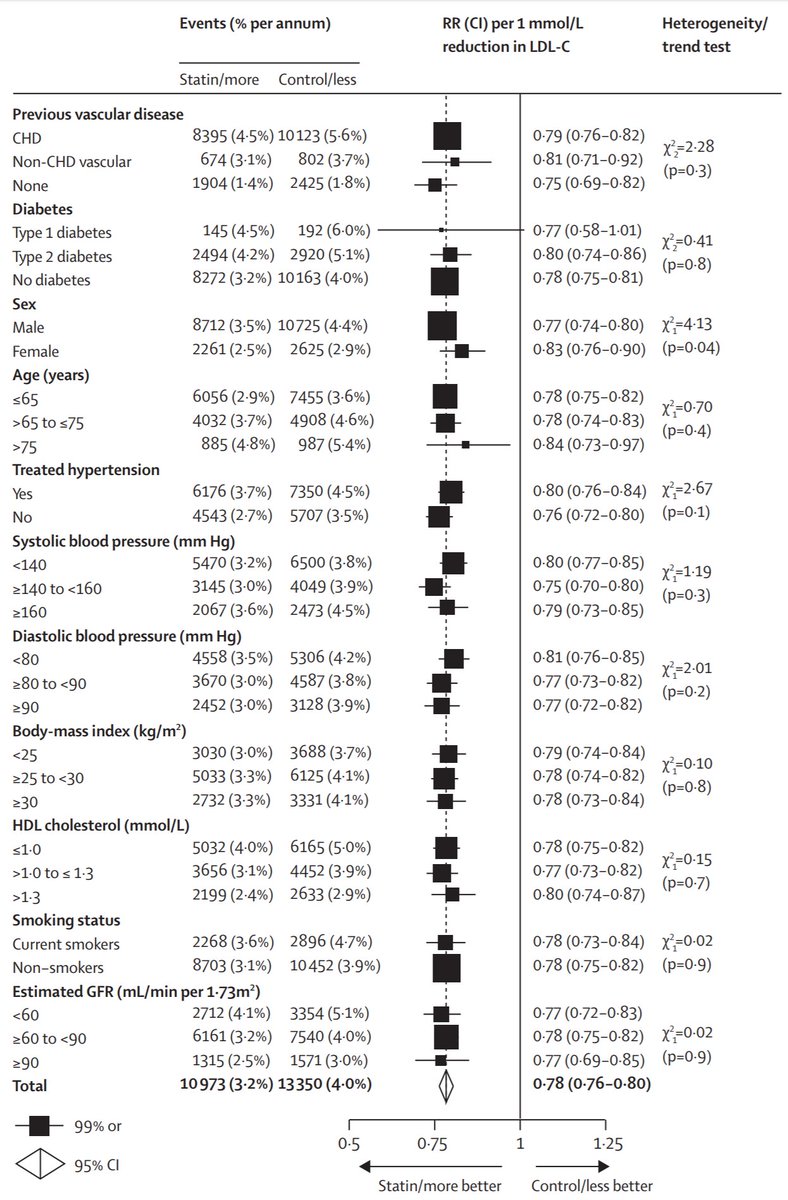
"Can we work out who is going to be one of the ones who gets lifespan extension, and who doesn't, so we can just treat them and save annoying everyone else?"
YES! We do this by running RCTs of statin and see who has the best hazard ratio.
Sorry that I seem to keep coming back to the CTT analysis.
It's just that it is VERY GOOD for this type of question.
They tried slicing the data by many methods that we use to stratify risk.
Age, BP, HDL etc.
Which of these found slices that DID NOT get benefit?
It's just that it is VERY GOOD for this type of question.
They tried slicing the data by many methods that we use to stratify risk.
Age, BP, HDL etc.
Which of these found slices that DID NOT get benefit?
OK.
Instead of looking forlornly for the "no benefit" 90%. Let's look even for people with just "LESS benefit".
Look at the right column, and its P values. Only one suggests a notable difference in the risk ratios. Which categorisation?
Instead of looking forlornly for the "no benefit" 90%. Let's look even for people with just "LESS benefit".
Look at the right column, and its P values. Only one suggests a notable difference in the risk ratios. Which categorisation?
So in that one "slicing" that you found, how different were the two effects? The two Relative Risks?
A Night and Day: worked in one, totally failed in other
B Worked in both, but twice as much in one than other
C A bit better in one than the other
A Night and Day: worked in one, totally failed in other
B Worked in both, but twice as much in one than other
C A bit better in one than the other
So to answer Amanda's second question, no we haven't found any good way of working out whether you are going to be in the ~90% who are going to die on the same day regardless of statin, or the ~10% who have an extra 5-10 years on average.
Amanda asks a third question. All these questions are good, Amanda: keep them coming! 
As one ages, one's risk of getting IHD rises. Every passing decade of age increases your risk 3 fold. Man or woman, regardless of nationality, it goes up
Evidence of this is here (using IHD _death_ rates, from the World Health Organisation via Finegold ncbi.nlm.nih.gov/pmc/articles/P…)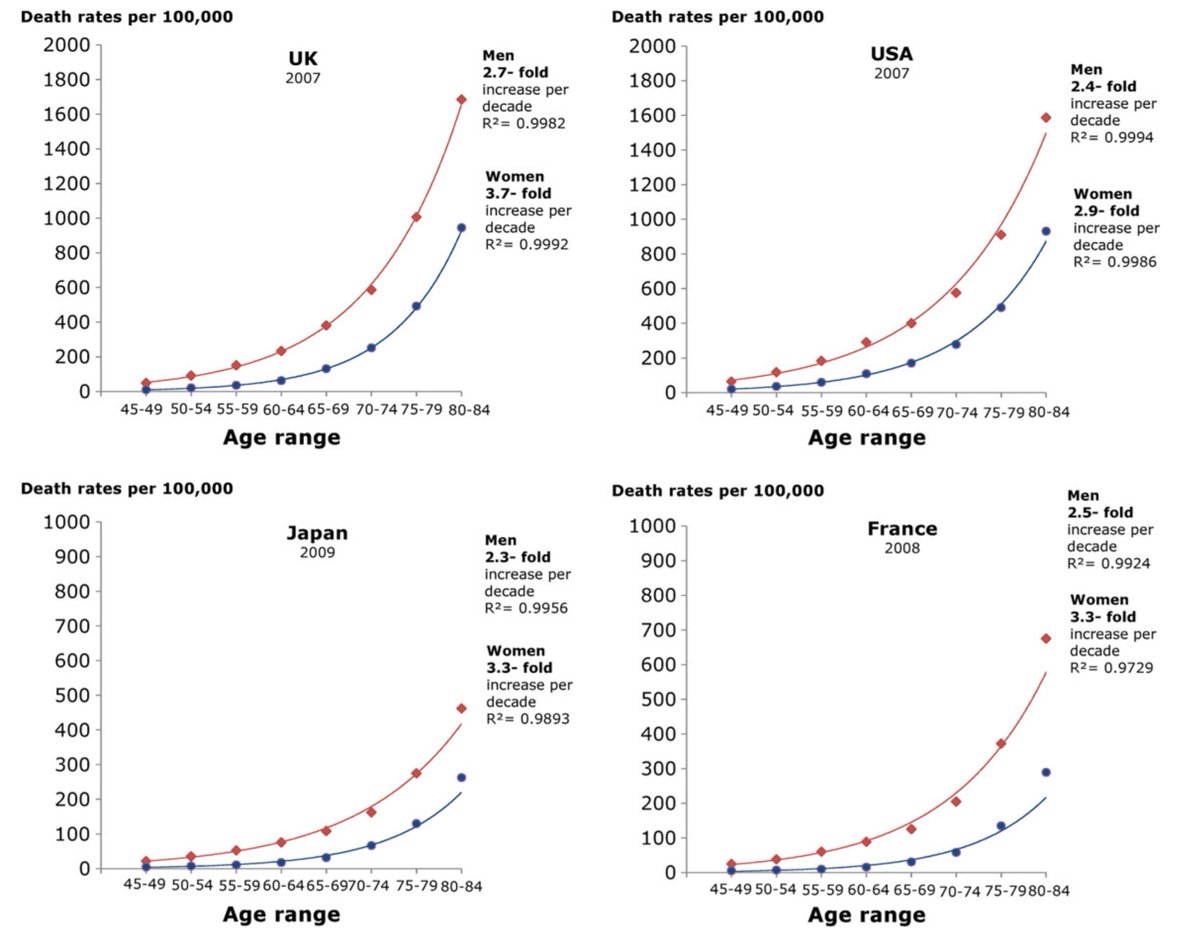
Evidence of this is here (using IHD _death_ rates, from the World Health Organisation via Finegold ncbi.nlm.nih.gov/pmc/articles/P…)
So IHD risk goes up dramatically with age. How does the RELATIVE risk reduction delivered by statins change with age? 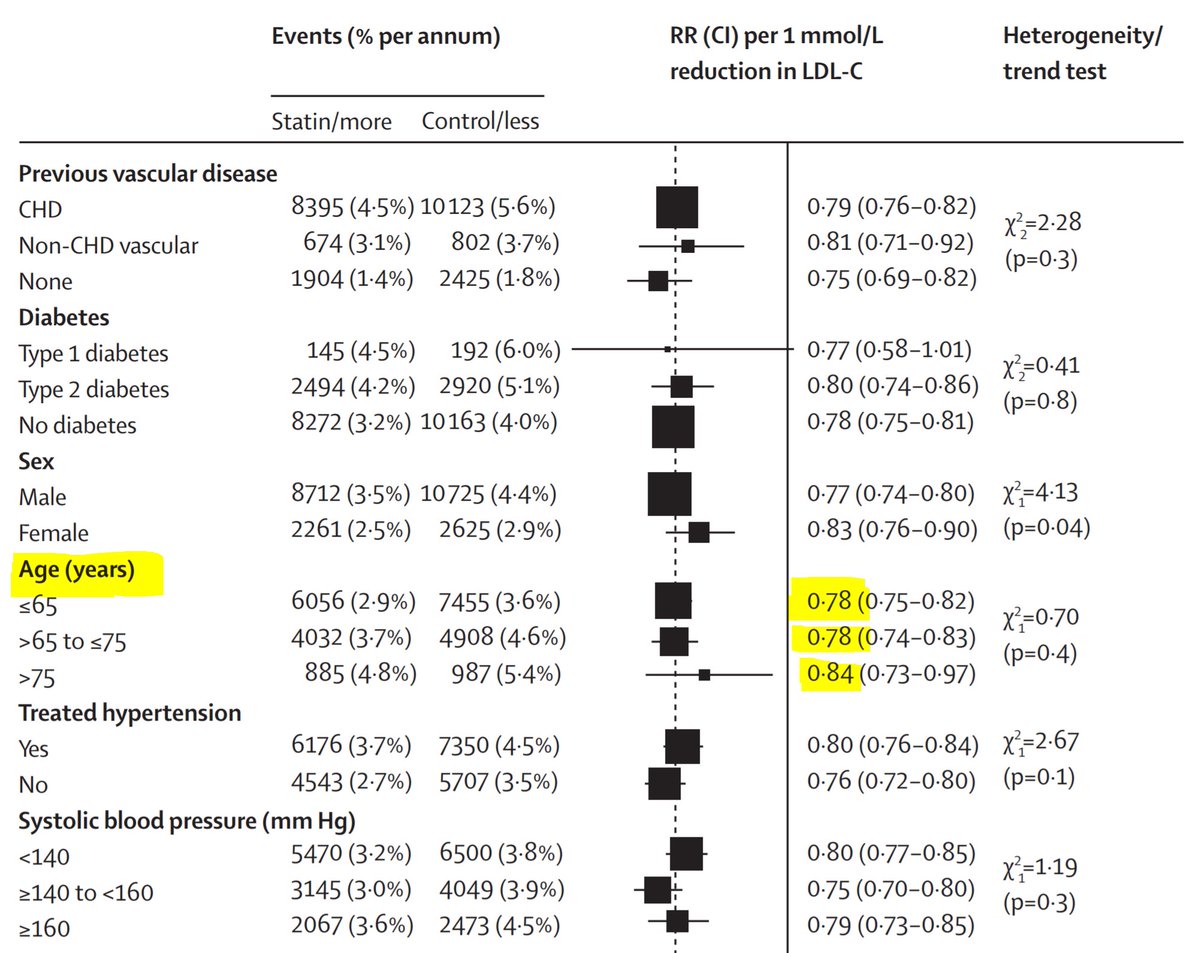
As age goes up from <65, to 65-75, to >75, how does the Risk Ratio exerted by statins vary?
I would accept EITHER "about steady" OR "maybe weakens a bit" as correct answers.
Definitely DOES NOT get 3-fold weaker with 10-year age increment. 0.78 (=22% below 1.00) would have to become 3 times closer to 1, i.e. 21%/3 = ~0.07 away, i.e. 0.93. It's not that.
Definitely DOES NOT get 3-fold weaker with 10-year age increment. 0.78 (=22% below 1.00) would have to become 3 times closer to 1, i.e. 21%/3 = ~0.07 away, i.e. 0.93. It's not that.
Therefore, with 10 years of ageing,
there is a three-fold increase in IHD rates
and the RISK RATIO with statins stays approx 0.80, so what happens to the ABSOLUTE RISK REDUCTION with statins?
there is a three-fold increase in IHD rates
and the RISK RATIO with statins stays approx 0.80, so what happens to the ABSOLUTE RISK REDUCTION with statins?
So the WHO data and the CTT 2010 together confirm the first sentence of your 3rd question, Amanda. Yes, as we age, the ABSOLUTE risk reduction in a fixed time window from statins, increases.
But I am NOT arguing it is anything to do with LDL, HDL or anything in particular.
But I am NOT arguing it is anything to do with LDL, HDL or anything in particular.
Please do not try to equate statins with LDL, HDL or any other DL.
Statins are death prevention tablets.
People debate the mechanism, some fluently with immense knowledge of the data (@skathire) and others do it half-wittedly with limited grasp of even basic logic or arithmetic.
Statins are death prevention tablets.
People debate the mechanism, some fluently with immense knowledge of the data (@skathire) and others do it half-wittedly with limited grasp of even basic logic or arithmetic.
I have my own views on mechanism, but they may be wrong, so I am trying not to pass them on. I watch the debate on mechanism largely to gauge the intelligence of the debaters.
Suffice it to say, Maryanne Demasi was at one end of the spectrum of that. The only useful thing I learned from her was how long you could get away with copy-pasting gel bands, on multiple occasions, almost adjacently, in a published paper.
15 years.
15 years.
External Tweet loading...
If nothing shows, it may have been deleted
by @ProfDFrancis view original on Twitter
Venk Murthy has pointed out that the Statisticians are getting agitated about the 7% benefit/93% don't benefit observation in our paper. 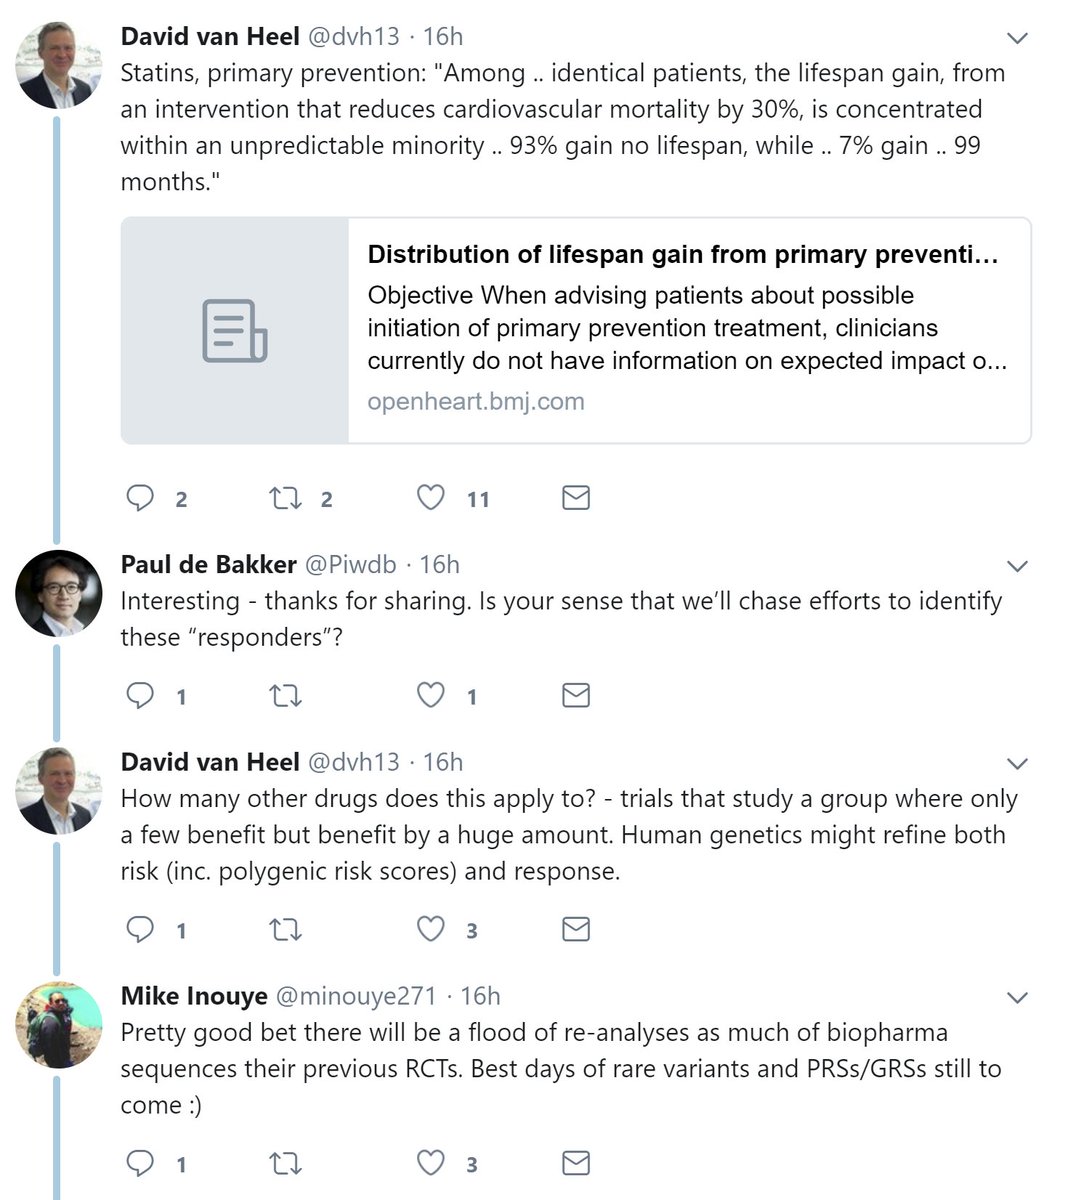
They are right to fear that we clinicians will waste our time looking for the 7% in advance.
Rest assured, statistical friends, the paper makes clear that this is PURELY the result of PROBABILITY in action. In the paper there is NO way to identify who will be in the 7%.
Rest assured, statistical friends, the paper makes clear that this is PURELY the result of PROBABILITY in action. In the paper there is NO way to identify who will be in the 7%.
Think of it as a game of Russian Roulette.
All the information is in the ratio between bullets and chambers.
All the information is in the ratio between bullets and chambers.
You can stratify your genotype, age, height, weight, sexual orientation all you like. In the end this gives you a probability.
Still you can't meddle with the randomness, only identify the probability. Until we can stratify people to probabilities of 0 or 1, this calc will hold.
Still you can't meddle with the randomness, only identify the probability. Until we can stratify people to probabilities of 0 or 1, this calc will hold.
OMG
Nobody wants to get a question from BOTH Ethan Weiss and Sek Kathiresan.
Like giving a math talk at a primary school and finding Albert Einstein and Isaac Newton raising their hands. "We were discussing, couldn't agree, and wondered your opinion..."
#NotGoingToBeEasy 🤔
Nobody wants to get a question from BOTH Ethan Weiss and Sek Kathiresan.
Like giving a math talk at a primary school and finding Albert Einstein and Isaac Newton raising their hands. "We were discussing, couldn't agree, and wondered your opinion..."
#NotGoingToBeEasy 🤔
Zoomed in, it looks like this. I don't know what the squiggly things on the right are all about. Some sort of clever molecular stuff.
Better keep quite and not admit to not know what I am talking about.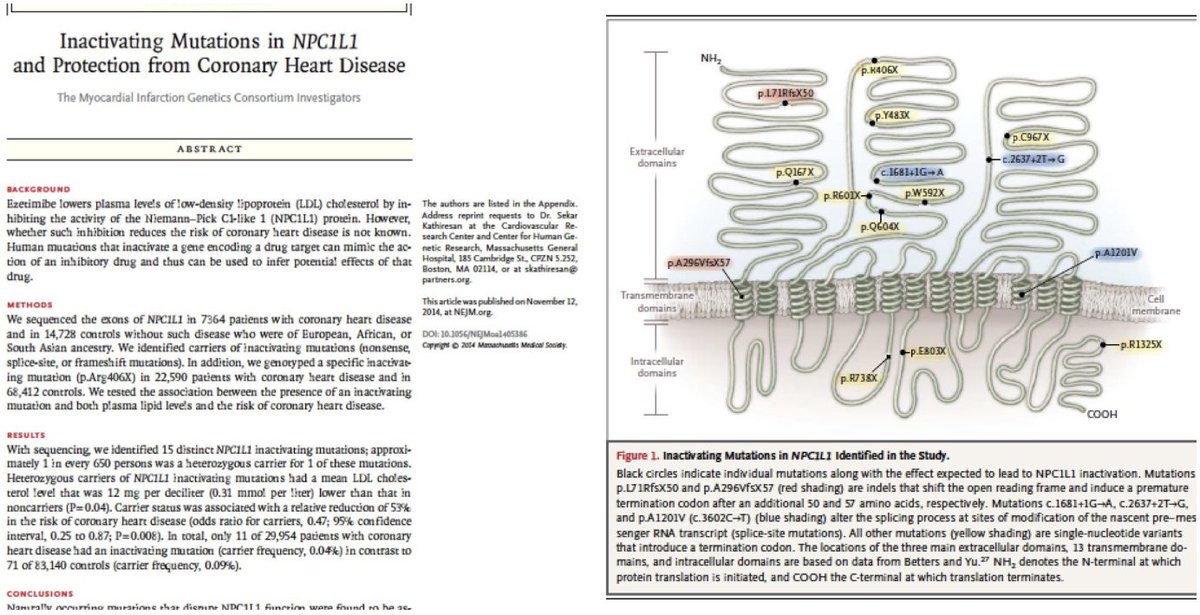
Better keep quite and not admit to not know what I am talking about.
In my medical school I had a special class in how, when someone puts up a figure like this, to lean forward, appear to be scrutinising it, stroke your beard, make "Hmmm" noises, then suddenly lean back, smiling, as if you have understood it all
Prize goes to the most convincing.
Prize goes to the most convincing.
OK as best as I can understand it, Sek Kathiresan in his own NEJM paper [I shall act as though I'm not impressed] has shown this:
(a) There is a gene defect resembling the effect of ezetimibe
(b) Present in 1 in 650 people
(c) Drops LDL 0.31 mM (12 mg/dl)
(d) HALVES coro disease
(a) There is a gene defect resembling the effect of ezetimibe
(b) Present in 1 in 650 people
(c) Drops LDL 0.31 mM (12 mg/dl)
(d) HALVES coro disease
HALVES?!?!
That's a lot bloody better than bloody ezetimibe, whose IMPROVE-IT trial had to be dragged on for year upon year until the investigators themselves had nearly died.
OK his question: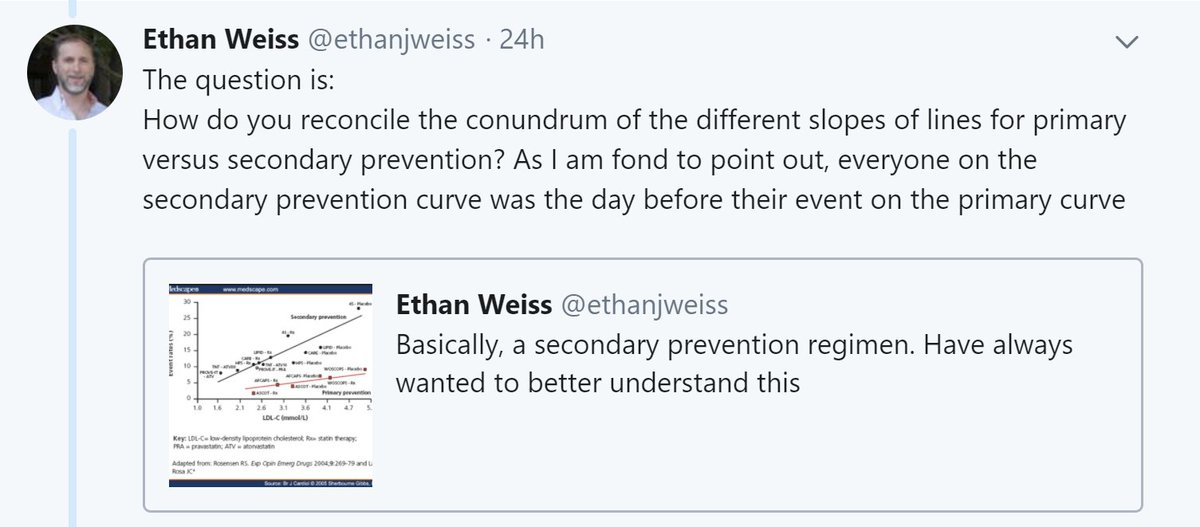
That's a lot bloody better than bloody ezetimibe, whose IMPROVE-IT trial had to be dragged on for year upon year until the investigators themselves had nearly died.
OK his question:
Let me answer a different question first.
'If the Ezetimibe gene is so amazingly brilliant that it halves coro disease, how come "acquired Ezetimibe" is so feeble?'
'If the Ezetimibe gene is so amazingly brilliant that it halves coro disease, how come "acquired Ezetimibe" is so feeble?'
Is the gene equal to 20mg ezetimibe?
Is it because people don't take their meds?
The IMPROVE-IT trial will instantly answer this.
Am surprised people didn't look. I train my team not to just make up stuff: look to see if someone has published a proper scientific report.
Is it because people don't take their meds?
The IMPROVE-IT trial will instantly answer this.
Am surprised people didn't look. I train my team not to just make up stuff: look to see if someone has published a proper scientific report.
[Side-rant: If only #ORBITA critics would work to the same level of fact-checking as my most elementary student, I would have to spend less time educating them on rudiments of reason.]
In IMPROVE-IT, how much did the ezetimibe, prescribed at 10mg od, reduce LDL?
In IMPROVE-IT, how much did the ezetimibe, prescribed at 10mg od, reduce LDL?
That was in the trial where they were PRESCRIBED 10mg. They may or may not have taken it. They had a 0.4mM drop despite ONLY having 10mg and MAYBE not even taking the damn thing.
Is this LESS than the 0.31 mM drop seen in Sek's NEJM paper of "Genetic Ezetimibe"?
Is this LESS than the 0.31 mM drop seen in Sek's NEJM paper of "Genetic Ezetimibe"?
IMPROVE-IT showed what Relative Risk Reduction in CV endpoints?
HINT. In snapshot above, it says "hazard ratio, 0.936"
HINT. In snapshot above, it says "hazard ratio, 0.936"
So the DRUG lowers LDL by MORE (0.4 mM) than the gene (0.31mM).
But the DRUG lowers CV events by LESS (6%) than the gene (~50%).
But the DRUG lowers CV events by LESS (6%) than the gene (~50%).
They both work by the same pathway. The big difference is the time they have to do you good.
The gene has a lifetime to influence the pathway.
The drug can only start when you start to take it.
Sadly, we keep assessing risk OVER A LIMITED TIME for primary prevention.
The gene has a lifetime to influence the pathway.
The drug can only start when you start to take it.
Sadly, we keep assessing risk OVER A LIMITED TIME for primary prevention.
So we always miss out on prevention for those that have the most to gain: the youngest, who are always at the lowest limited-term risk.
Sad but true.
Sad but true.
Ethan's actual question is this: 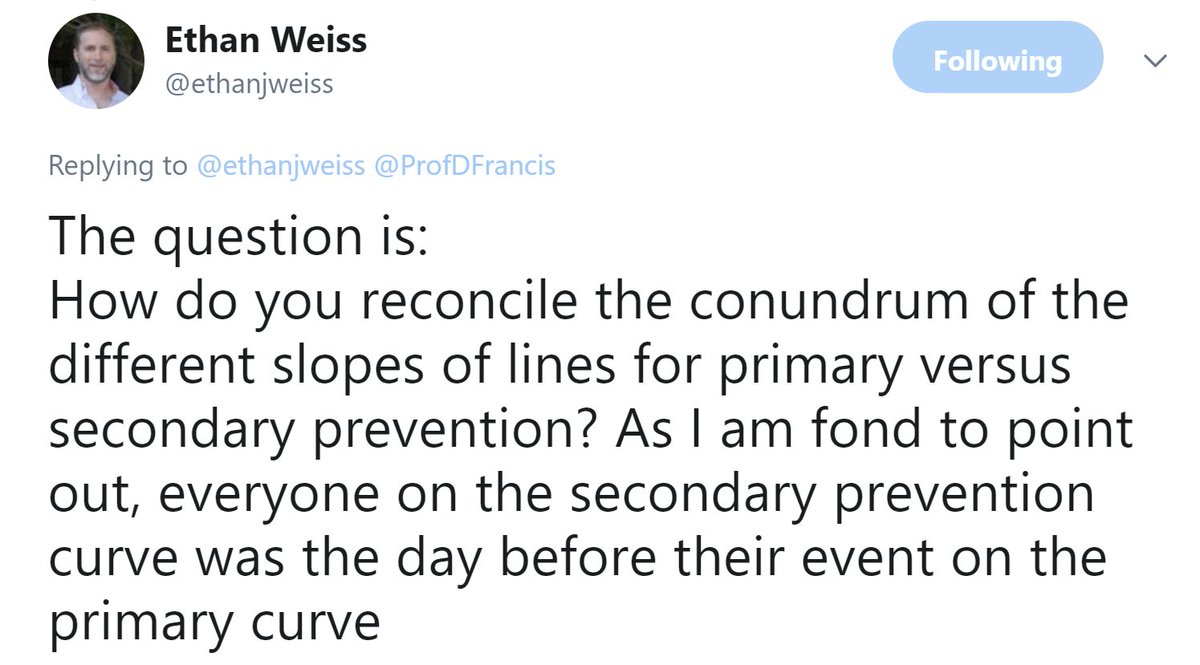
I would answer it as follows. Yes the day before the infarct, the secondary was primary, but he was surrounded by a whole load of other guys who were also primary, and just hadn't got together enough atheroma, inflammation, and plaque instability get give themselves an MI.
Looking at them in a football stadium, you can't see which is which. But you can wait, and one of them keels over with a heart attack? That's him! That's the one. Pull him into your "Secondary" set.
The "Secondary" set is is just the "Primary" set with many people removed.
The "Secondary" set is is just the "Primary" set with many people removed.
If there is a risk factor in Primary, it is likely to manifest in Secondary too. But if you have got rid of (say) 90% of the people from the primary to make the secondary, you will also enhance the slope of all the risk factors by 10-fold.
If my explanation is right, then by whatever scale factor the curves have been lifted "up", they should also have been tilted by. 
So here is the killer moment. The one where I can be shown up as a cretin.
Gulp.
I reckon the top line POSITION at any point on the x axis is about 3x the bottom line.
And I reckon the top slope is about 3x the bottom slope.
Of course I might be talking sh!t. Can anyone calc?
Gulp.
I reckon the top line POSITION at any point on the x axis is about 3x the bottom line.
And I reckon the top slope is about 3x the bottom slope.
Of course I might be talking sh!t. Can anyone calc?
If so this would suggest that there are about 2/3 of people who are not going to get a heart attack under typical circumstances.
Going for secondary, "gets rid" of them and leaves us with an enriched 1/3 who have 3x the risk of the overall group, and 3x the sensitivity to LDL etc
Going for secondary, "gets rid" of them and leaves us with an enriched 1/3 who have 3x the risk of the overall group, and 3x the sensitivity to LDL etc
If I am right then a similar graph can be plotted with the X axis being BP, or HbA1c, etc, and it will still work.
Fun for a fellow to do? Anyone with you Ethan or you Sek who might be interested?
It's basically so crazy that I bet nobody has done it. I like such papers.
Fun for a fellow to do? Anyone with you Ethan or you Sek who might be interested?
It's basically so crazy that I bet nobody has done it. I like such papers.
STATIN WARS PART 3
==============
NNT strikes back! (not)
An explanation for NNT that even statin deniers can understand!
Please use this info to deal with people who try to kill your patients for fun and profit.
==============
NNT strikes back! (not)
An explanation for NNT that even statin deniers can understand!
Please use this info to deal with people who try to kill your patients for fun and profit.
One problem with statin deniers is that the most vocal amongst them have poor understanding of clinical trials, inferential logic, or even basic arithmetic. This is the kindest explanation I can think of for their repeated circling around the same invalid arguments.
Jonas works in an Emergency Room. He sees people with broken bones. Trouble is, 3% of patients get crenulation of the bone that prevents proper healing. The hospital is embarrassed by its high crenulation rate.
Francis Industrial Bonehealing offers Jonas a new bone-fixing tool, which prevents crenulation. Apparently there is a 1/3 reduction of crenulation, if people use F.I.B.
Published in Br J Sports Med, so must be OK
Applying F.I.B., what can Jonas get the crenulation rate down to?
Published in Br J Sports Med, so must be OK
Applying F.I.B., what can Jonas get the crenulation rate down to?
The Hospital Boss is not easily impressed.
"This will cost us a fortune."
Remember, this is in the UK, where we can't just spend an extra few tens of thousands, and stick the patient with the bill.
"How many patients do we have to treat to prevent one crenulation?"
"This will cost us a fortune."
Remember, this is in the UK, where we can't just spend an extra few tens of thousands, and stick the patient with the bill.
"How many patients do we have to treat to prevent one crenulation?"
We will get the crenulation rate down from 3/100 to 2/100.
If we treat 100 patients, how many people do we save from crenulation ?
If we treat 100 patients, how many people do we save from crenulation ?
That was in a 30-day study.
The crenulation all occurs within the first 24 hours. After that the molecule CREN-Kinase (pictured below) disappears.
No crenulations occur in the remaining 29 days.
I do a longer term study, lasting 1 year. No more crenulations occur.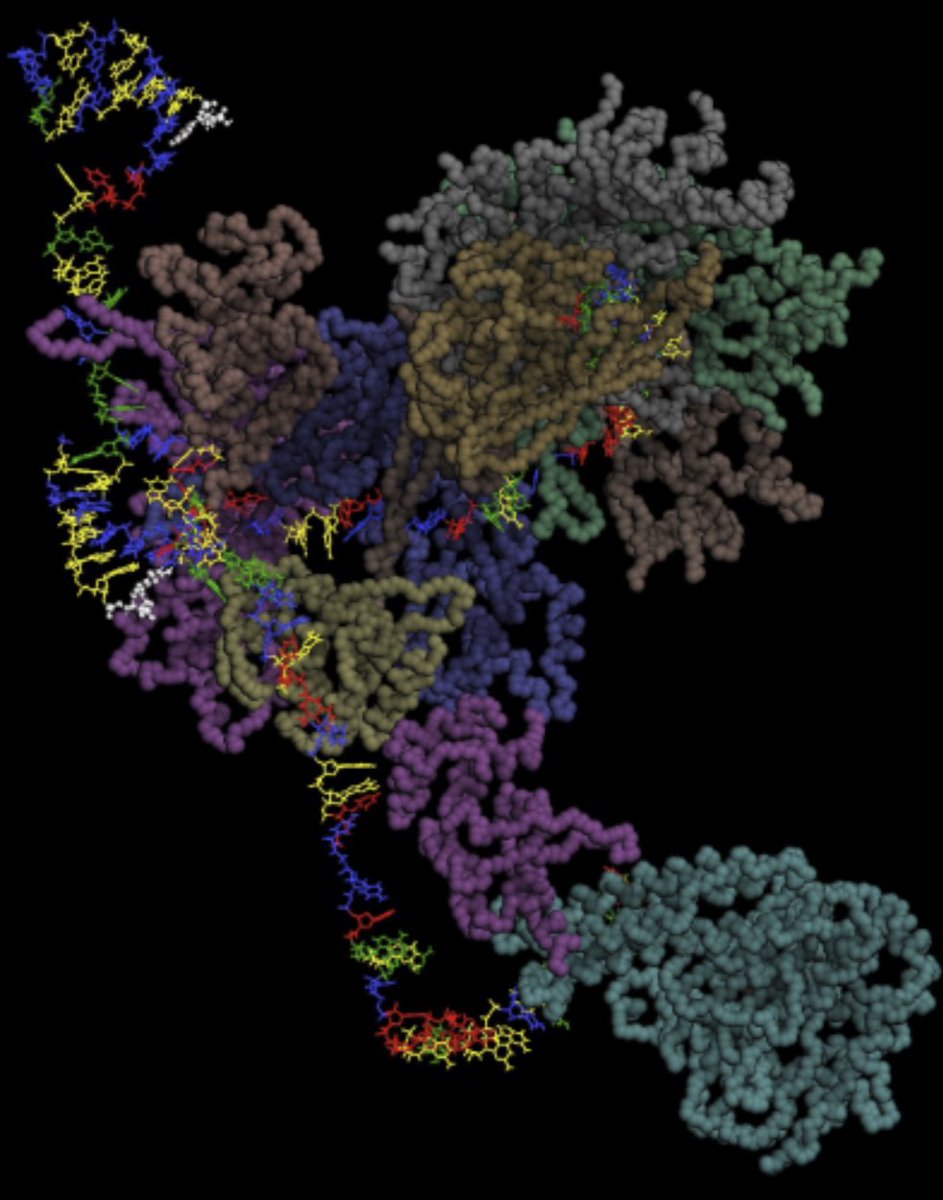
The crenulation all occurs within the first 24 hours. After that the molecule CREN-Kinase (pictured below) disappears.
No crenulations occur in the remaining 29 days.
I do a longer term study, lasting 1 year. No more crenulations occur.
OK so whatever time point I take, it is 3% versus 2%, so lets just remind ourselves:
what is the ABSOLUTE risk reduction (ARR)
and the RELATIVE risk reduction (RRR)?
Sorry to labour but we MUST get this right now. Vital.
what is the ABSOLUTE risk reduction (ARR)
and the RELATIVE risk reduction (RRR)?
Sorry to labour but we MUST get this right now. Vital.
"You've got to treat 100 patients to prevent one crenulation, here," says the Boss, shaking his head sadly.
"But on the Paediatric ward, Francis Linear Intergrated Medicine provides a Flow-Line Arbitrometric Motivator", which greatly reduces discombobulation."
"But on the Paediatric ward, Francis Linear Intergrated Medicine provides a Flow-Line Arbitrometric Motivator", which greatly reduces discombobulation."
"With FLIM-FLAM, discombobulation rates come down from 40% to 30%," he reads from the advert in Br J Sports Med. "Now that is really something!"
If we treat a hundred children with FLIM-FLAM, how many fewer discombobulations would we have?
If we treat a hundred children with FLIM-FLAM, how many fewer discombobulations would we have?
How many children do we need to treat, to prevent ONE discombobulation?
We get TEN prevented if we treat 100.
So to get ONE prevented we must treat ....
We get TEN prevented if we treat 100.
So to get ONE prevented we must treat ....
In the Emergency Room, what is the Number Needed to Treat (NNT) to prevent one crenulation?
In the Paediatric Emergency Ward, what is the NNT to prevent one discombobulation?
NNTs:
In the Paediatric Emergency Ward, what is the NNT to prevent one discombobulation?
NNTs:
And that's the beauty of NNT.
For a condition that is short lasting and you either GET or DONT GET something bad, we can give a treatment and calculate the difference in bad things happening.
For a condition that is short lasting and you either GET or DONT GET something bad, we can give a treatment and calculate the difference in bad things happening.
If the ABSOLUTE difference is 1/10, you need to treat 10 to prevent 1 event.
If the ABSOLUTE difference is 1/100, you need to treat 100 to prevent 1 event.
In fact if you can write the ABSOLUTE difference as 1/SOMETHING, the NNT is "SOMETHING"
If the ABSOLUTE difference is 1/100, you need to treat 100 to prevent 1 event.
In fact if you can write the ABSOLUTE difference as 1/SOMETHING, the NNT is "SOMETHING"
Quick test.
Suppose primary PCI (versus fibrinolysis) reduces 30 day mortality from 8% to 7%.
What is the number needed to treat to prevent one death within 30 days?
Suppose primary PCI (versus fibrinolysis) reduces 30 day mortality from 8% to 7%.
What is the number needed to treat to prevent one death within 30 days?
NNT is handy way of describing the added value of an expensive or unpleasant therapy for use in EMERGENCY SITUATIONS or ONE-OFFS.
Does it give any different information from the ARR (Arrrr, shiver me timbers, mateys!)
Does it give any different information from the ARR (Arrrr, shiver me timbers, mateys!)
What do you think?
NNT is more advanced than ARR. (No beard or parrot)
NNT is more flexible than ARR. (Can express complex situations)
NNT is statistically preferable by clever folk like Frank Harrell @f2harrell
NNT give identical information to ARR
NNT is more advanced than ARR. (No beard or parrot)
NNT is more flexible than ARR. (Can express complex situations)
NNT is statistically preferable by clever folk like Frank Harrell @f2harrell
NNT give identical information to ARR
The formula for NNT is
NNT = 1 / ARR
So it is NOT true that it is "more advanced".
NNT = 1 / ARR
So it is NOT true that it is "more advanced".
Suppose you want to say that the ARR for discombobulation is 10% (95% CI -5% to +25%).
You just say that.
But try it with NNT
NNT is 10 (95% CI, er, oh bollocks.... to 4)
That's not flexible, that's inane.
You just say that.
But try it with NNT
NNT is 10 (95% CI, er, oh bollocks.... to 4)
That's not flexible, that's inane.
Or an even simpler case.
Without Rx, 80%.
With Rx, 20%.
ARR = 60%
NNT = 1/0.6 = 1.667 .... eh?
It is NOT more flexible, unless you like confidence intervals that wrap round to infinity and back again. Maybe you are an astrophysicist and like this sort of thing. I don't.
Without Rx, 80%.
With Rx, 20%.
ARR = 60%
NNT = 1/0.6 = 1.667 .... eh?
It is NOT more flexible, unless you like confidence intervals that wrap round to infinity and back again. Maybe you are an astrophysicist and like this sort of thing. I don't.
"Only people who've never computed a confidence interval would favour NNT."
Albert Einstein
Br J Sports Med
Albert Einstein
Br J Sports Med
Oh here is @f2harrell Frank Harrel's view on it 
OK let me not bash NNT totally. When you want to quickly convey SMALL values of ARR, you might like to use it.
For example, instead of 0.01% you might say 1/10,000. That's just an ARR.
If you want to say that is an NNT of 10,000 but this just adds another layer of verbiage.
For example, instead of 0.01% you might say 1/10,000. That's just an ARR.
If you want to say that is an NNT of 10,000 but this just adds another layer of verbiage.
Emergency Room physicians are often in a hurry and don't have time to say "1/", so sometimes like to go straight for NNT.
A group of 7 ER physicians, together with 3 other people, have set up a site to idolise the NNT.
A group of 7 ER physicians, together with 3 other people, have set up a site to idolise the NNT.
Spot the common theme amongst 7 of them. 
It is an excellent site. For things that happen once, and you can either have a bad or good outcome ON THE SPOT.
No survival curves, no nothing. You are either OK or you are stuffed.
For those situations ARR works well. If your ARR at 24 hours is 2%, it stays 2% permanently.
No survival curves, no nothing. You are either OK or you are stuffed.
For those situations ARR works well. If your ARR at 24 hours is 2%, it stays 2% permanently.
And if you don't have time to say "2%" due to running around in ER, you can say "NNT 50":that's fine.
But where statin denialists go wrong is in trying to apply this where it cannot usefully be applied. To CHRONIC STABLE diseases with progressively varying numbers. Lets see why.
But where statin denialists go wrong is in trying to apply this where it cannot usefully be applied. To CHRONIC STABLE diseases with progressively varying numbers. Lets see why.
I run a new trial, FRANCIS-2, of a new statin that reduces all cause mortality by 10%.
I enrol a group of patients, with a 1% annual mortality.
What would the graph in the CONTROL group look like over 4 years?
It would start at 0% mortality at 0 years.
At 4 years, what mort?
I enrol a group of patients, with a 1% annual mortality.
What would the graph in the CONTROL group look like over 4 years?
It would start at 0% mortality at 0 years.
At 4 years, what mort?
And what will the STATIN arm mortality be at 4 years?
Remember it has a RELATIVE RISK REDUCTION of 10%.
Remember it has a RELATIVE RISK REDUCTION of 10%.
OK first 5 correct. So here is the picture. 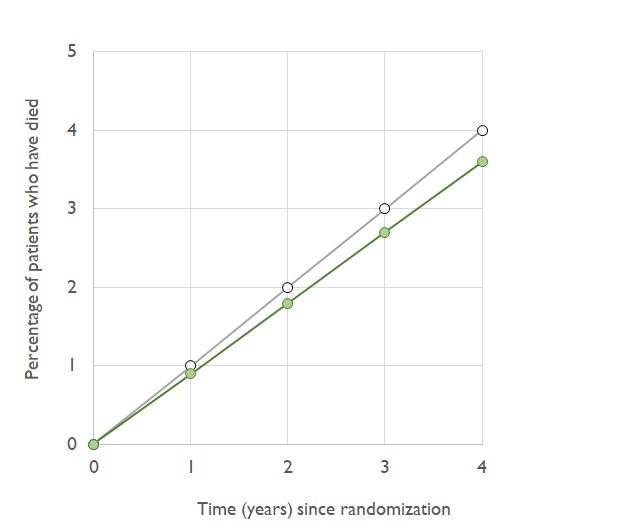
At 4 years, what is the ABSOLUTE risk reduction?
Risks are 4% in control, and 3.6% in statin.
Risks are 4% in control, and 3.6% in statin.
At two years, i.e. half way along, what is the ABSOLUTE risk reduction.
HINT
Look at the graph. The vertical gap is smaller at 2 years. How much smaller (super-hint, how much smaller is it if you go back to 0 years?)
HINT
Look at the graph. The vertical gap is smaller at 2 years. How much smaller (super-hint, how much smaller is it if you go back to 0 years?)
OK follow the pattern back. At 1 year, what would the absolute risk reduction be?
At 4 years, what was the NNT?
ARR = 0.4%.
NNT = what?
Remember, NNT is just a fancy way of saying "1 divided by ARR, me hearties!"
ARR = 0.4%.
NNT = what?
Remember, NNT is just a fancy way of saying "1 divided by ARR, me hearties!"
At 2 years, ARR = 0.2%
NNT = ?
NNT = ?
At 1 year, ARR = 0.1%.
NNT = ?
NNT = ?
I am ashamed to be a doctor.
--sigh--
Aseem Malhotra, come along and shoot me please.
First I will sign your anti statin manifesto with Sir Bufton Tufton who wants a public inquiry into arithmetic. Then I will help Maryanne Demasi with her Photoshopping.
Then kill me please.
--sigh--
Aseem Malhotra, come along and shoot me please.
First I will sign your anti statin manifesto with Sir Bufton Tufton who wants a public inquiry into arithmetic. Then I will help Maryanne Demasi with her Photoshopping.
Then kill me please.
Friends, friends, friends!
Sit back, relax, think back to primary school, OK? Happier, carefree days. Only easy stuff to do.
100 divided by 2 = 50
100 divided by 1 (a smaller number) = something MORE, yes, i.e. 100
so
100 divided by 0.4 (even smaller) = something EVEN MORE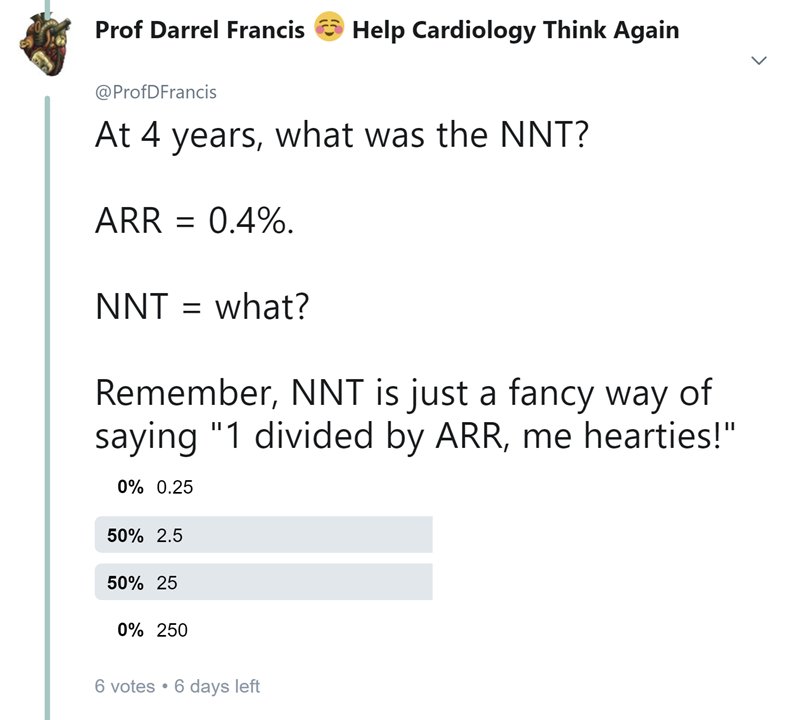
Sit back, relax, think back to primary school, OK? Happier, carefree days. Only easy stuff to do.
100 divided by 2 = 50
100 divided by 1 (a smaller number) = something MORE, yes, i.e. 100
so
100 divided by 0.4 (even smaller) = something EVEN MORE
With a heavy heart, I give you the answers.
I now know why you couldn't smack Malhotra, Demasi, Bufton Tufton, and the other nitwits, in the face swiftly. You weren't good at reciprocals.
That's why they settled on NNTs to bamboozle you. You are not good at 100/n.
I now know why you couldn't smack Malhotra, Demasi, Bufton Tufton, and the other nitwits, in the face swiftly. You weren't good at reciprocals.
That's why they settled on NNTs to bamboozle you. You are not good at 100/n.
1 y. ARR 0.1%. NNT = 1000.
2 y. ARR 0.2%. NNT = 500.
4 y. ARR 0.4%. NNT = 250.
Now, can you guess what would happen if we extrapolated the survival curves to continue?
8 y. ARR what, NNT what?
2 y. ARR 0.2%. NNT = 500.
4 y. ARR 0.4%. NNT = 250.
Now, can you guess what would happen if we extrapolated the survival curves to continue?
8 y. ARR what, NNT what?
OK, so we can have an NNT of 125, 250, 500 or 1000.
Which is true?
Which is true?
In the snapshot I have shown you of the 6 earliest voters (who didn't have the benefit of the right answers, like you do now), what percentage got the NNT calculation right?
To the nearest %.
To the nearest %.
Hi Dan, yes you were.
But that is why we all need to get fluent in percentages. Given the correct answer to the tweet immediately above this, this is why we have, effectively, morons, running rings round us. We don't have the wit to keep them off.
We need to get better.
But that is why we all need to get fluent in percentages. Given the correct answer to the tweet immediately above this, this is why we have, effectively, morons, running rings round us. We don't have the wit to keep them off.
We need to get better.
Remember, the correct answer _is_ 1/ARR not 100/ARR.
Think back to school. "%" is just shorthand for "/100", that's all, nothing more subtle.
1% is not, NOT, N*O*T 1. It is 1/100 or 0.01.
Even Aseem Malhotra can understand this and it is enough to leave us bemused.
Think back to school. "%" is just shorthand for "/100", that's all, nothing more subtle.
1% is not, NOT, N*O*T 1. It is 1/100 or 0.01.
Even Aseem Malhotra can understand this and it is enough to leave us bemused.
If ARR = 1%,
1/ARR = 1/ (1/100): that is what should pop up in your mind straight away.
That's obviously 100, not 1.
1/ARR = 1/ (1/100): that is what should pop up in your mind straight away.
That's obviously 100, not 1.
Of all the things we do for patients, stopping them smoking, getting a healthier lifestyle and explaining statins correctly are amongst the most likely to save lives.
We *need* to get fluent so we can deal with the propaganda put out by the statin-denialist nitwits.
We *need* to get fluent so we can deal with the propaganda put out by the statin-denialist nitwits.
Sorry to get angry but it is a matter of life and death for 1 in 10 patients who we allow to slip out of the protection of statins. It's my duty to get worked up and do my best to prepare us to give the best to our patients.
Will you keep the faith with these tweetorials?
Will you keep the faith with these tweetorials?
Anyway, back to the survival curves.
If things progress as before, by 10 years, there is what size difference between the two curves?
What absolute risk reduction?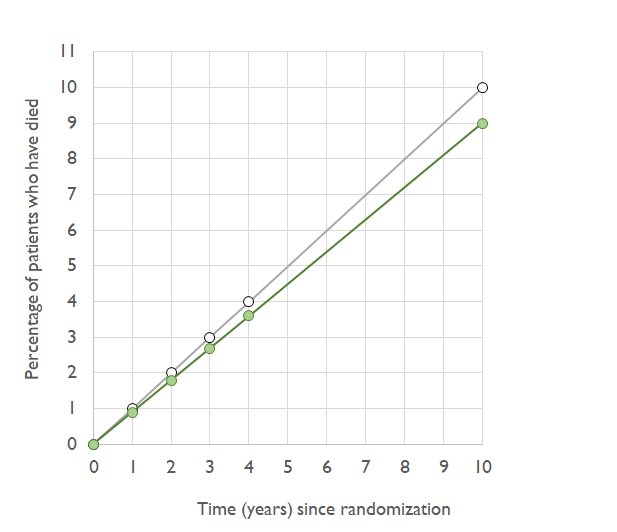
If things progress as before, by 10 years, there is what size difference between the two curves?
What absolute risk reduction?
At 10 years, the risks are
10% (thats 0.10 for people who can't remember what % means)
9% (or 0.09)
The ARR is the difference between them (use the right hand figures if keep forgetting what % means)
What is the NNT?
10% (thats 0.10 for people who can't remember what % means)
9% (or 0.09)
The ARR is the difference between them (use the right hand figures if keep forgetting what % means)
What is the NNT?
At that stage, 10 years, in the control arm 10% of people have died. In the active arm, you have saved 1% of all patients, getting the death rate down to 9%.
As the years progress, you will always have slightly better chance of surviving a year in the statin arm than placebo...
As the years progress, you will always have slightly better chance of surviving a year in the statin arm than placebo...
But eventually everyone in both arms has died.
You can calculate how much longer a lifespan you get in the active arm.
The calculation is shown in full here, in 2 computer languages (as Shun-Shin and Francis fought like children over which was "better")
openheart.bmj.com/content/3/1/e0…
You can calculate how much longer a lifespan you get in the active arm.
The calculation is shown in full here, in 2 computer languages (as Shun-Shin and Francis fought like children over which was "better")
openheart.bmj.com/content/3/1/e0…
At time 0, ARR is 0, NNT is infinity
As time passes, ARR increases, and NNT shrinks.
Eventually everyone gets old and dies, ARR shrinks again (as mortality in both arms approaches 100%) and NNT goes back to infinity.
ARR and NNT vary across the entire time course!
As time passes, ARR increases, and NNT shrinks.
Eventually everyone gets old and dies, ARR shrinks again (as mortality in both arms approaches 100%) and NNT goes back to infinity.
ARR and NNT vary across the entire time course!
Don't waste your life tying to compare NNTs for chronic stable conditions. You will only go utterly crazy, because everything you learn one moment will be overturned when you move to a different time point or risk stratum.
Life's too short.
Focus on the RATIO.
CTT 2010 again: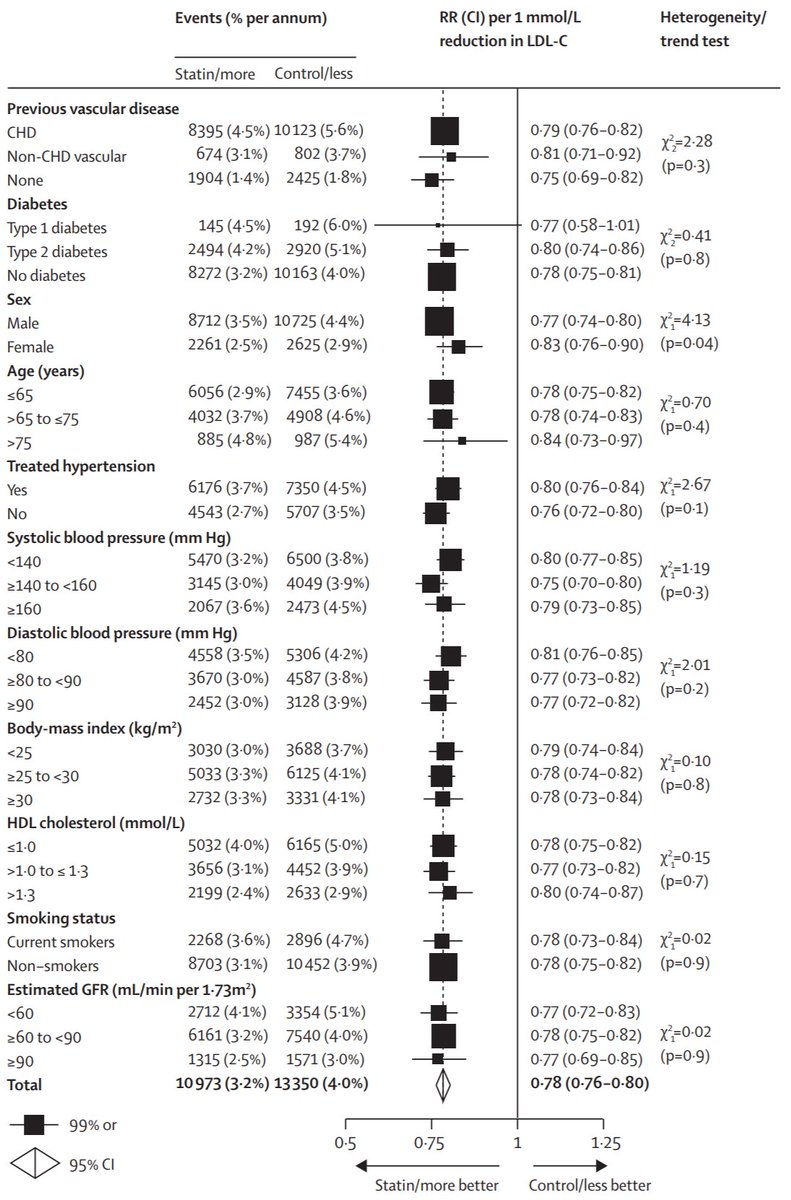
Life's too short.
Focus on the RATIO.
CTT 2010 again:
Another way to look at it is "How many months extra should I expect to live, on average, on a statin?"
That is also in our paper "Distribution etc."
openheart.bmj.com/content/3/1/e0…
That is also in our paper "Distribution etc."
openheart.bmj.com/content/3/1/e0…
In reality those average lifespan extensions, e.g. "7 months", are still only an average.
In practice, as we said, WITHIN THIS CALCULATION about 90% of people die of SOMETHING ELSE (so statins don't help) or die of a heart attack despite statins (so statins don't help)
In practice, as we said, WITHIN THIS CALCULATION about 90% of people die of SOMETHING ELSE (so statins don't help) or die of a heart attack despite statins (so statins don't help)
Very roughly:
1000 people
700 die of non-cardiac disease (no effect on them)
Of the remainder, 200 still die on their original date as they would without statin, and the remainder die later.
So 100 people live longer.
1000 people
700 die of non-cardiac disease (no effect on them)
Of the remainder, 200 still die on their original date as they would without statin, and the remainder die later.
So 100 people live longer.
But the longer-livedness of these 100 people makes the OVERALL AVERAGE LIFESPAN go up by about 7 months.
How is it possible?
Becacuse they live 70 months longer, on average. 6 Years.
How is it possible?
Becacuse they live 70 months longer, on average. 6 Years.
So the deal you are making when taking a statin is that you are taking a chance.
Approx 90% chance that you will die on the day you would have died without the statin, and about 10% chance that you will live longer - by 5-10 years.
Approx 90% chance that you will die on the day you would have died without the statin, and about 10% chance that you will live longer - by 5-10 years.
1 in 10 chance of living 5-10 years longer? I would take that. You might not. Up to you.
But if people, who are not your doctor, tell you NOT to do that I am here to back you up, because I want you to live longer if you want to live longer.
But if people, who are not your doctor, tell you NOT to do that I am here to back you up, because I want you to live longer if you want to live longer.
People who try to confuse you with wrong calculations, NNTs that are meaningless over the wrong timewindow, false accusations against CTT for doing exactly what a responsible scientific organisation does,
I will expose them and call them nitwits.
It is not nice, but they are not nice.
And I, most definitely, am not nice.
g'night!
It is not nice, but they are not nice.
And I, most definitely, am not nice.
g'night!
• • •
Missing some Tweet in this thread? You can try to
force a refresh