Inspired by the big ol' long list of deep learning models I saw this morning, and @SpaceWhaleRider's love of science-y A-Z lists, I've decided to create an A to Z series of tweets on popular #MachineLearning and #DeepLearning methods / algorithms.
Ready? Here we go:
Ready? Here we go:
A is for... the Apriori Algorithm!
Intended to mine frequent itemsets for Boolean association rules (like market basket analysis). Ex: if someone purchases the same products as you, in general, then you'd probably purchase something they've purchased.
cran.r-project.org/web/packages/a…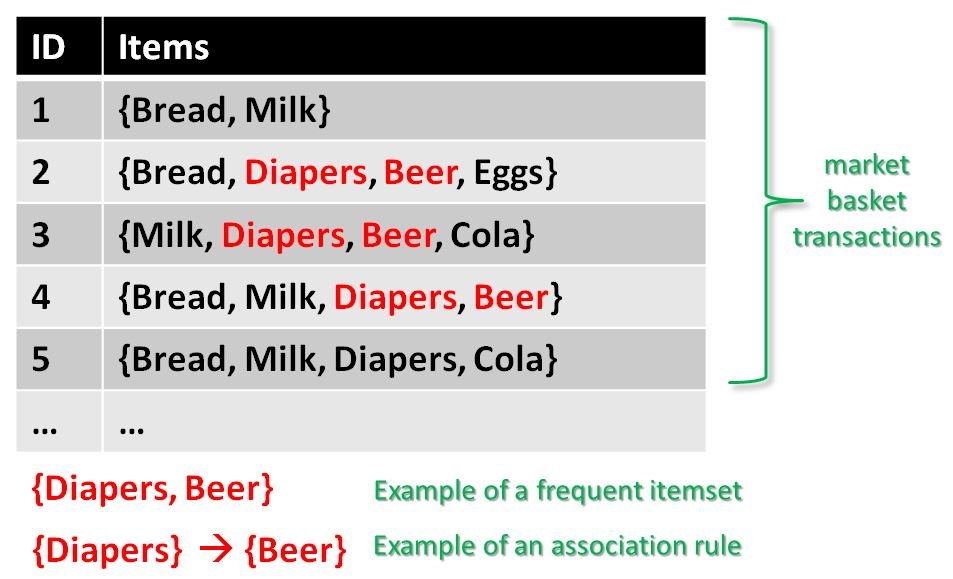
Intended to mine frequent itemsets for Boolean association rules (like market basket analysis). Ex: if someone purchases the same products as you, in general, then you'd probably purchase something they've purchased.
cran.r-project.org/web/packages/a…

B is for... Bootstrapped Aggregation (Bagging)!
This is an ensemble meta-algorithm designed to improve the stability and accuracy of machine learning algorithms used in statistical classification+regression. Reduces variance, helps to avoid overfitting.
Example: Random Forests.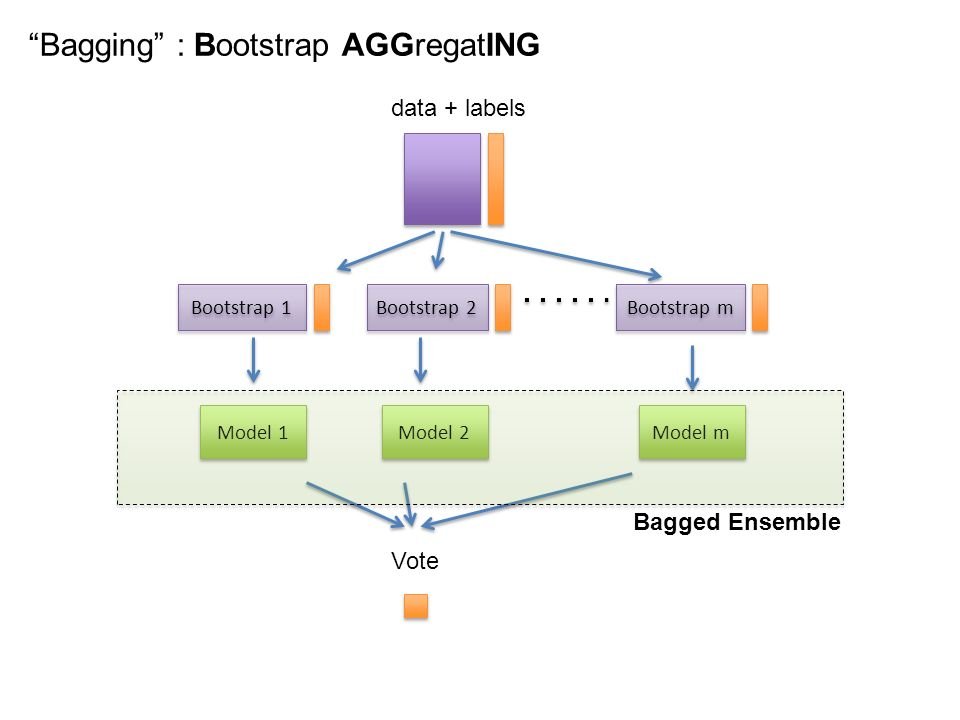
This is an ensemble meta-algorithm designed to improve the stability and accuracy of machine learning algorithms used in statistical classification+regression. Reduces variance, helps to avoid overfitting.
Example: Random Forests.

C is for... Convolutional Neural Networks (ConvNet, CNN)!
Feed-forward artificial neural networks used for analyzing visual imagery. Use multiple layers of perceptrons (nodes), and require minimal processing in comparison to machine learning algorithms.
tensorflow.org/tutorials/deep…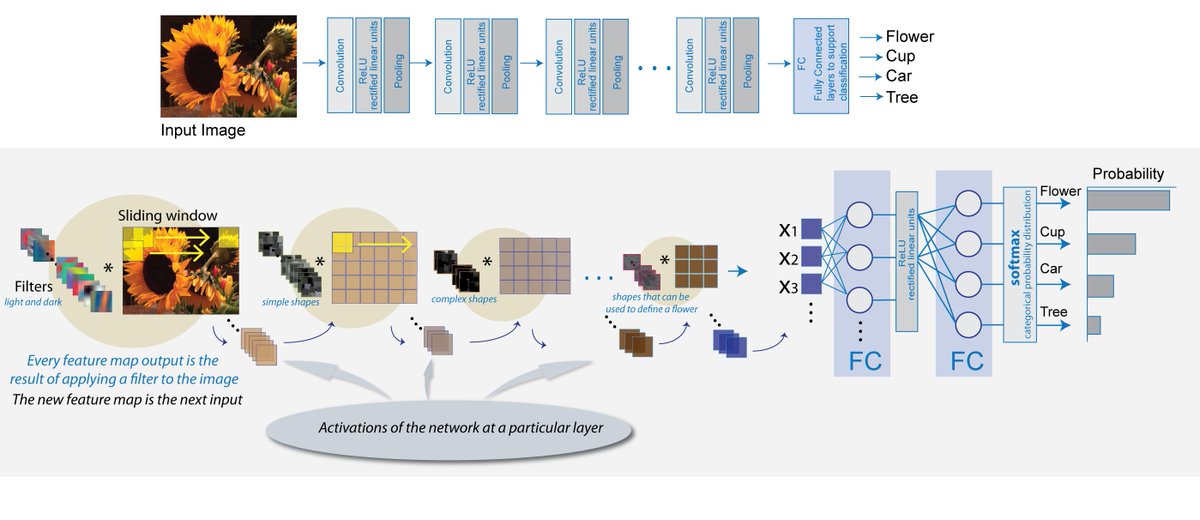
Feed-forward artificial neural networks used for analyzing visual imagery. Use multiple layers of perceptrons (nodes), and require minimal processing in comparison to machine learning algorithms.
tensorflow.org/tutorials/deep…

D is for... Decision Trees (my favorite)!
Decision support tools that use a tree-like graph or model of decisions and their possible consequences, including chance event outcomes, resource costs, and utility. C5.0 is the standard.
cran.r-project.org/web/packages/C…
scikit-learn.org/stable/modules…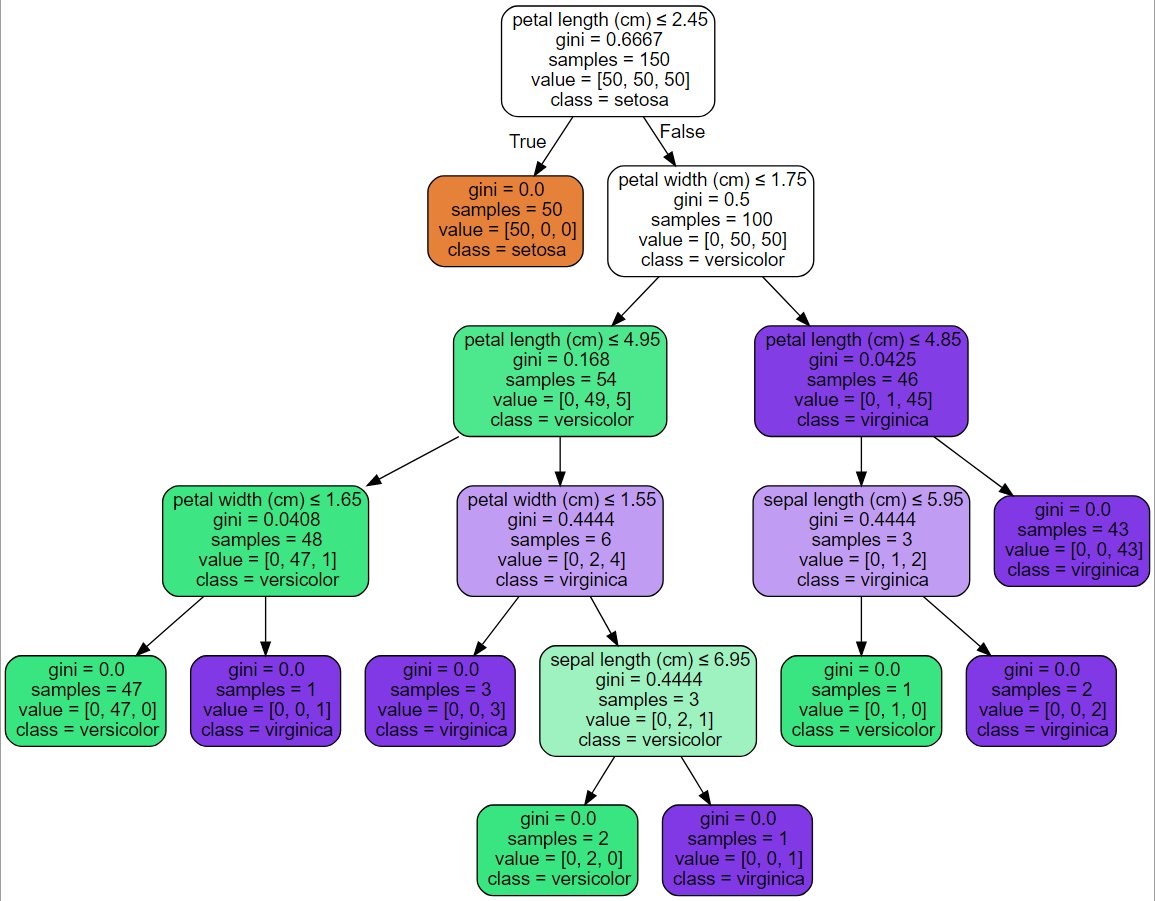
Decision support tools that use a tree-like graph or model of decisions and their possible consequences, including chance event outcomes, resource costs, and utility. C5.0 is the standard.
cran.r-project.org/web/packages/C…
scikit-learn.org/stable/modules…

E is for... Elastic Net Regularization!
Regularized regression method that combines L1 and L2 penalties of lassio and ridge methods. Can be reduced to the linear support vector machine (2014); and full disclosure, I haven't really played with this much.
scikit-learn.org/stable/modules…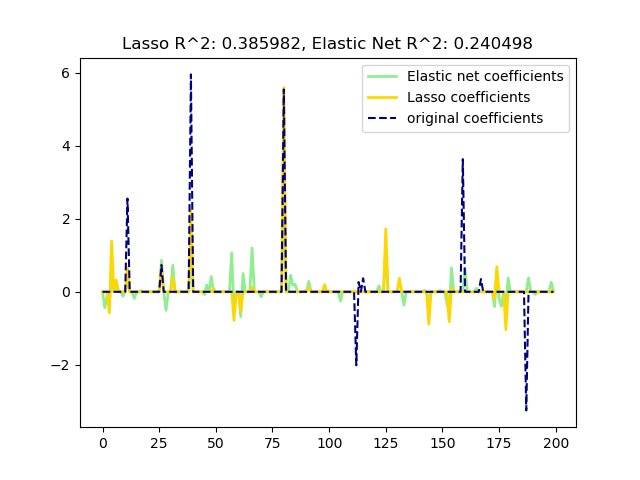
Regularized regression method that combines L1 and L2 penalties of lassio and ridge methods. Can be reduced to the linear support vector machine (2014); and full disclosure, I haven't really played with this much.
scikit-learn.org/stable/modules…

F is for... Faster R-CNN! Remember those convolutional neural networks we talked about before? They're gonna come up a lot.
This is newish (2016); introduces a Region Proposal Network (RPN) whose aim is real-time object detection.
arxiv.org/pdf/1506.01497…
github.com/rbgirshick/py-…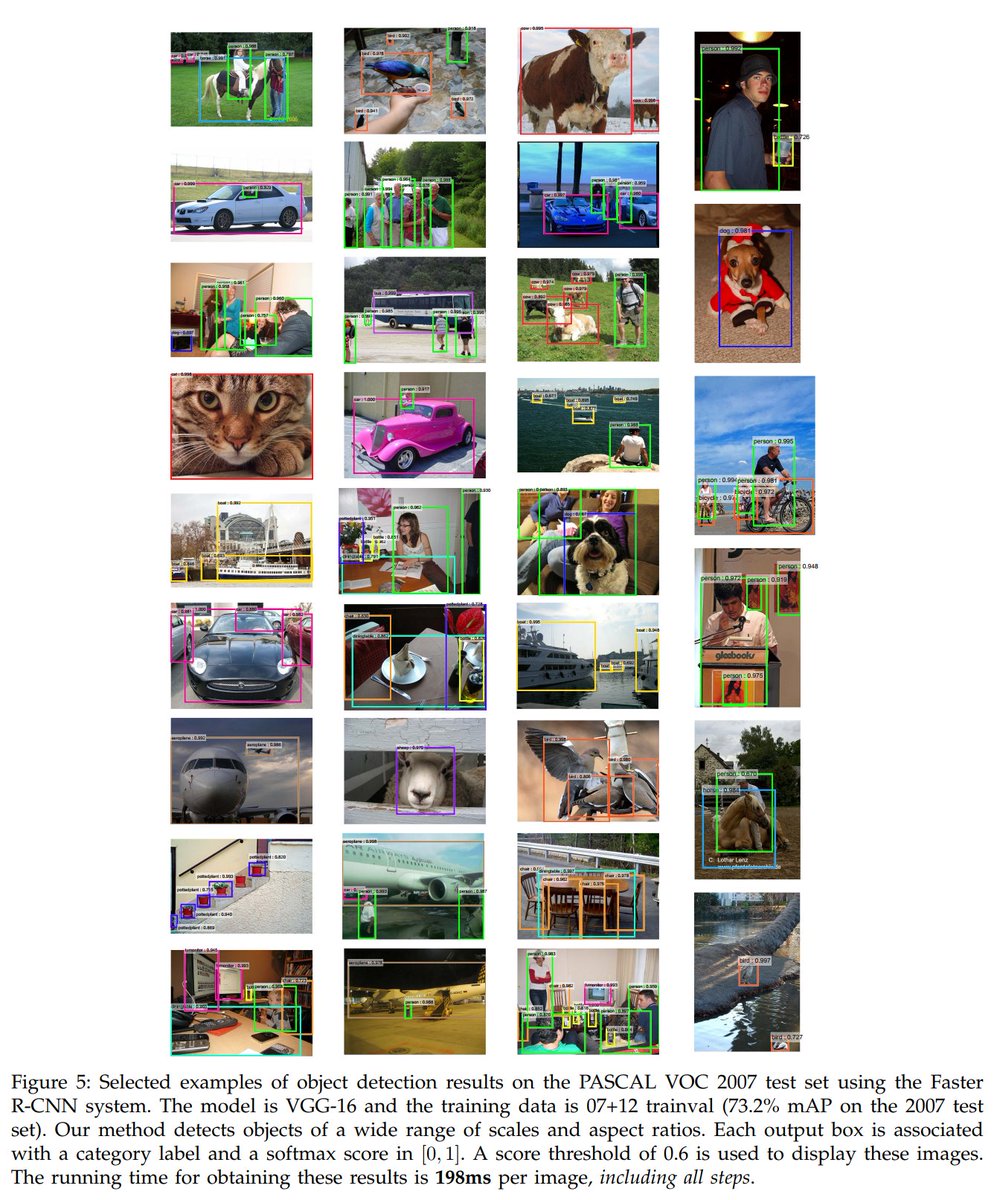
This is newish (2016); introduces a Region Proposal Network (RPN) whose aim is real-time object detection.
arxiv.org/pdf/1506.01497…
github.com/rbgirshick/py-…

G is for... Generative Adversarial Networks (GANs)!
Closest thing to magic; you probably know them best for creating photorealistic images of scenes/topics. Two neural networks contesting w/ each other.
Link to @goodfellow_ian's workshop from NIPS 2016:
arxiv.org/pdf/1701.00160…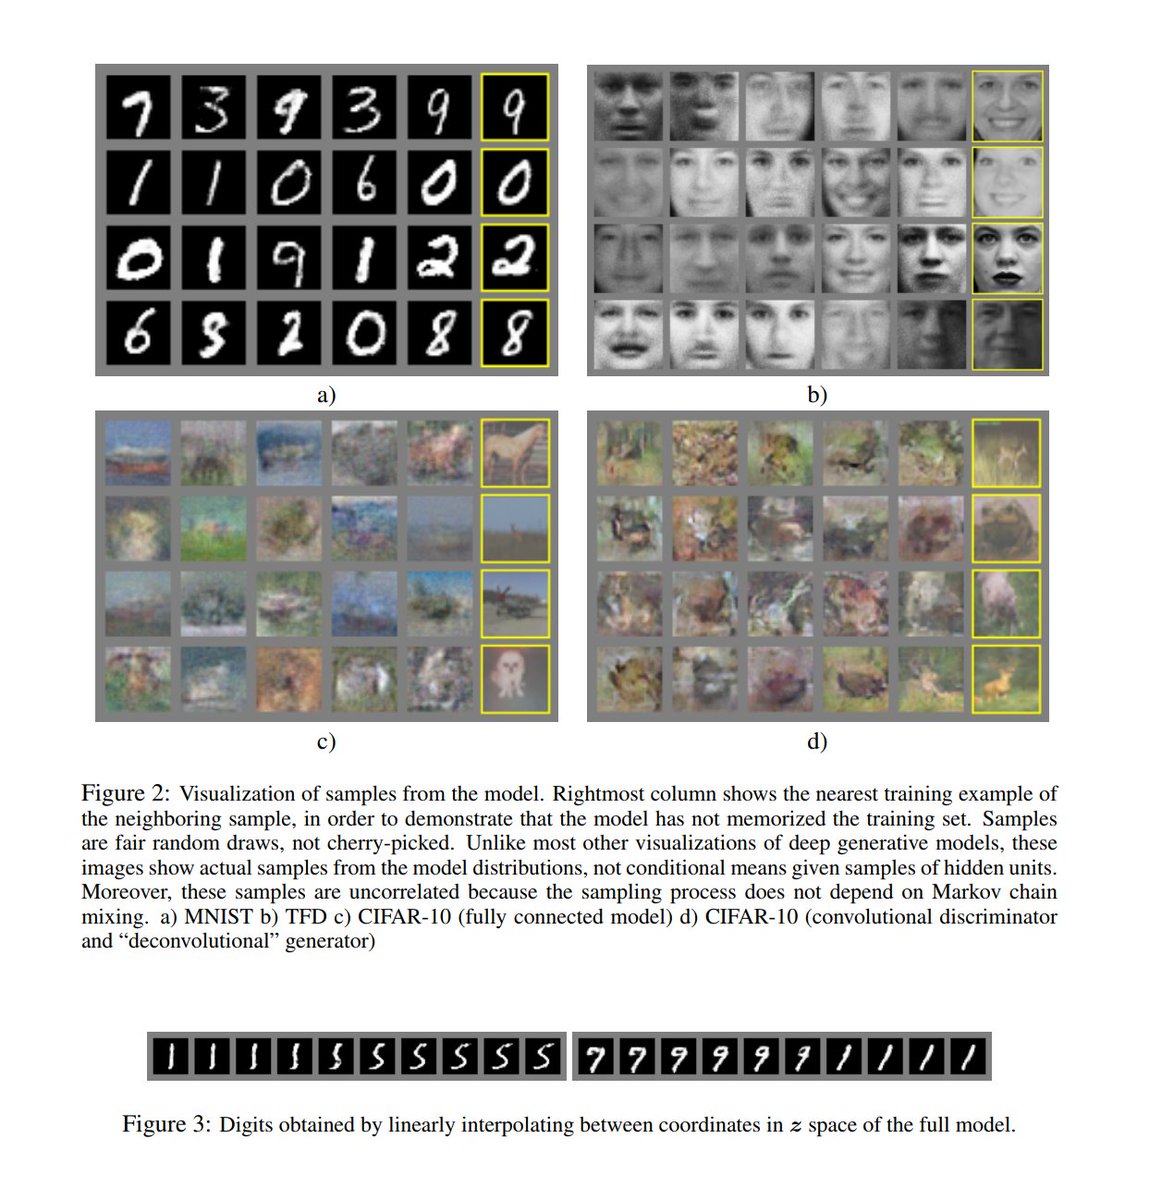
Closest thing to magic; you probably know them best for creating photorealistic images of scenes/topics. Two neural networks contesting w/ each other.
Link to @goodfellow_ian's workshop from NIPS 2016:
arxiv.org/pdf/1701.00160…

H is for... Hierarchical Cluster Analysis (HCA)!
This is a method of cluster analysis that attempts to build a hierarchy of subclusters -- a multilevel hierarchy -- and a cluster tree (dendrogram). I've only done this in R.
Ex: pvclust() and rpuclust():
cran.r-project.org/web/packages/p…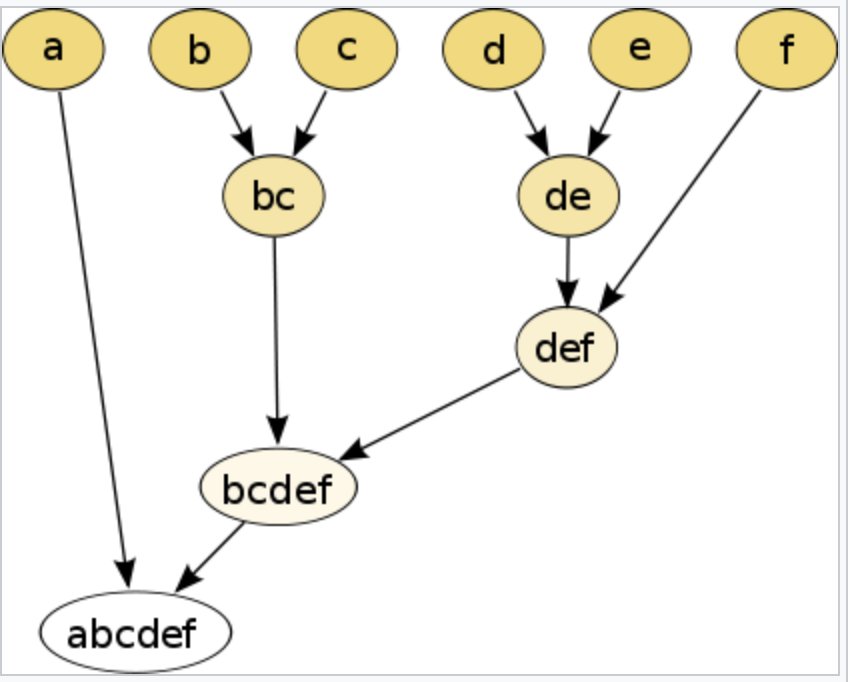
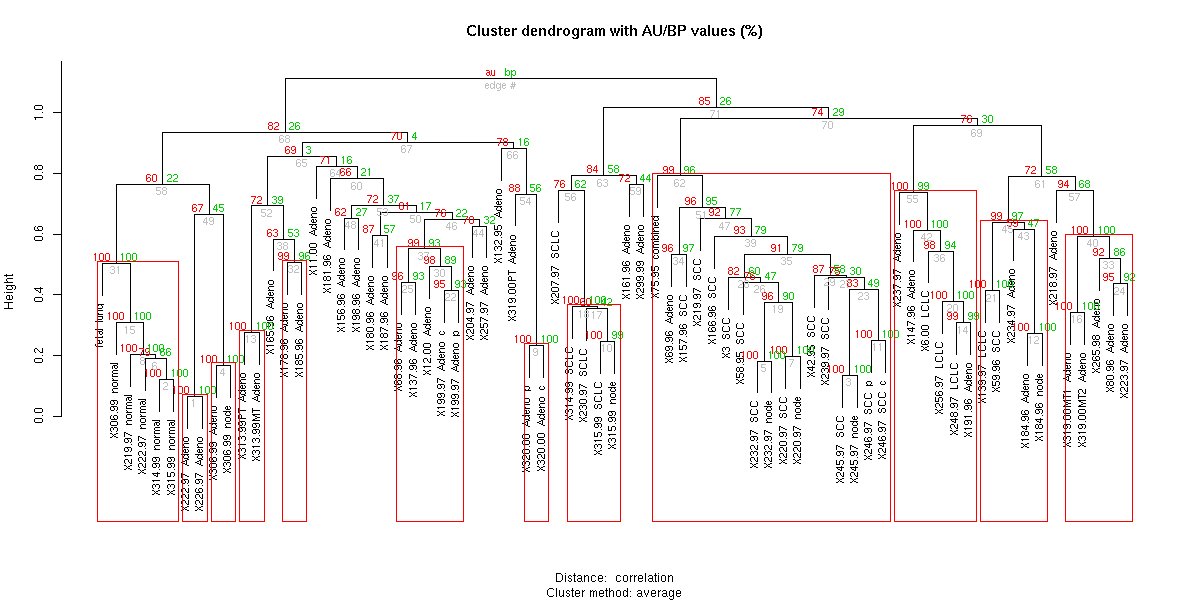
This is a method of cluster analysis that attempts to build a hierarchy of subclusters -- a multilevel hierarchy -- and a cluster tree (dendrogram). I've only done this in R.
Ex: pvclust() and rpuclust():
cran.r-project.org/web/packages/p…


I is for... Inception! (Which should probably be GoogleNet, but G was taken.)
Revolutionary because it showed CNNs don't have to be stacked sequentially; you can be creative about your structures, and it improves performance and computational efficiency.
cv-foundation.org/openaccess/con…
Revolutionary because it showed CNNs don't have to be stacked sequentially; you can be creative about your structures, and it improves performance and computational efficiency.
cv-foundation.org/openaccess/con…
J is for... the Johnson-Lindenstrauss bound for embedding with random projections!
This states that any high-dimensional dataset can be randomly projected into a lower-dimensional space, while still controlling the distortion. (Dimensionality reduction.)
scikit-learn.org/stable/auto_ex…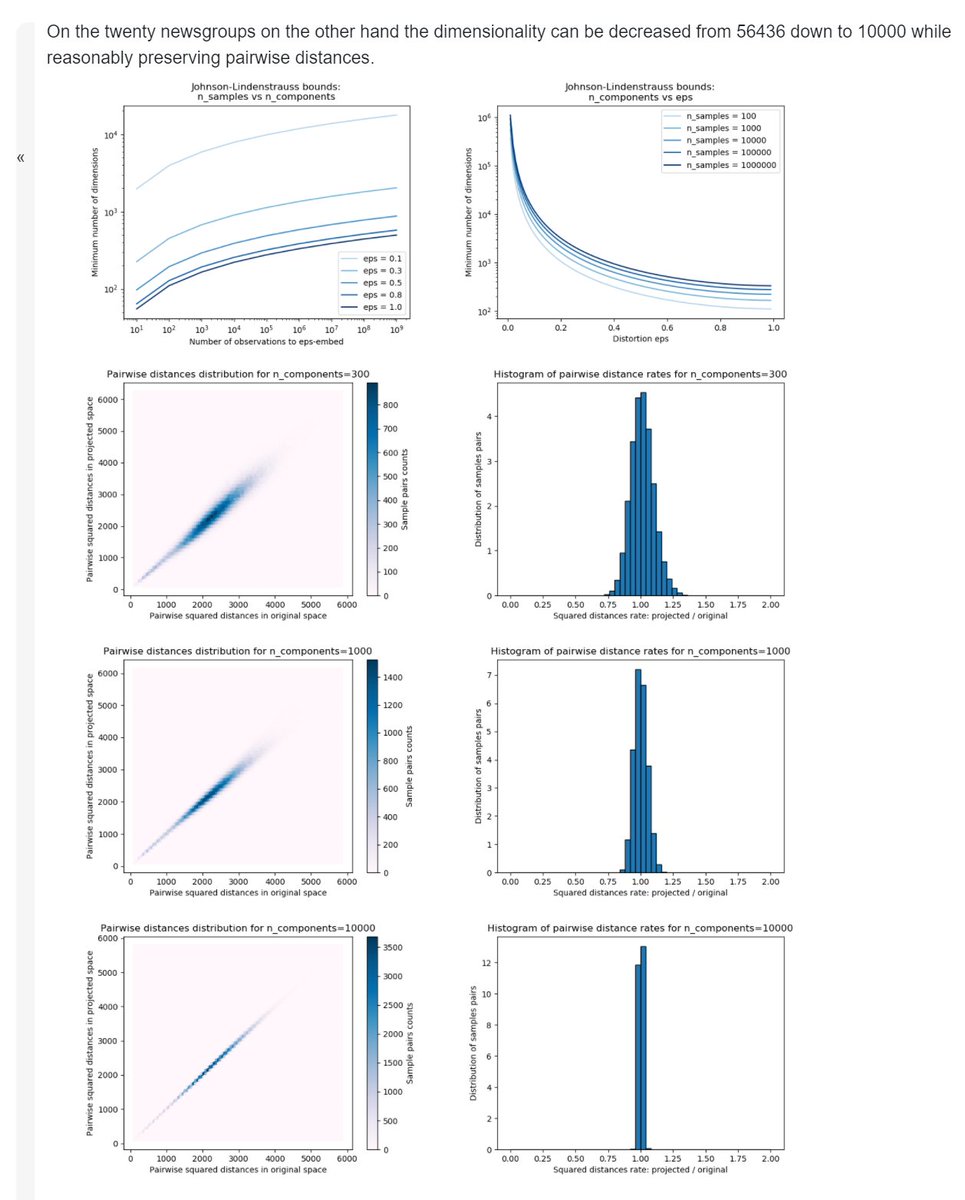
This states that any high-dimensional dataset can be randomly projected into a lower-dimensional space, while still controlling the distortion. (Dimensionality reduction.)
scikit-learn.org/stable/auto_ex…

K is for.. k-Means Clustering!
The name's a bit explanatory: you attempt to group observations into a subset of k clusters based on proximity to the cluster with the nearest mean (centroid). End result looks like a Voronoi diagram (if you've seen those).
scikit-learn.org/stable/modules…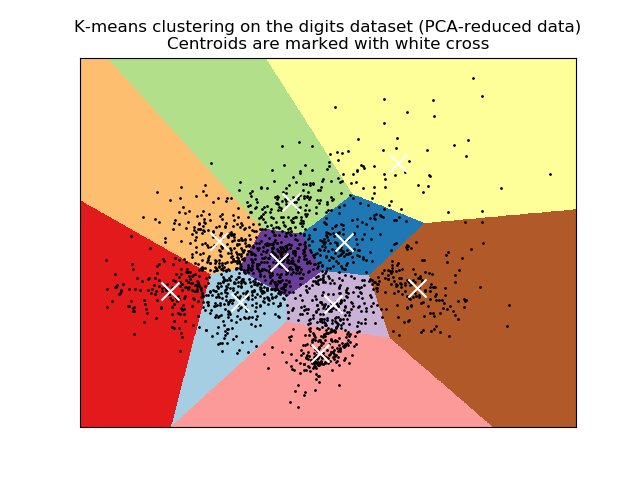
The name's a bit explanatory: you attempt to group observations into a subset of k clusters based on proximity to the cluster with the nearest mean (centroid). End result looks like a Voronoi diagram (if you've seen those).
scikit-learn.org/stable/modules…

L is for... Linear Regression!
Which, I kid you not, is a line of best fit given a set of observations. If you've been fitting lines on data in Excel and seeing the R-squared values returned, you've technically been doing machine learning. Congrats! 😊
scikit-learn.org/stable/auto_ex…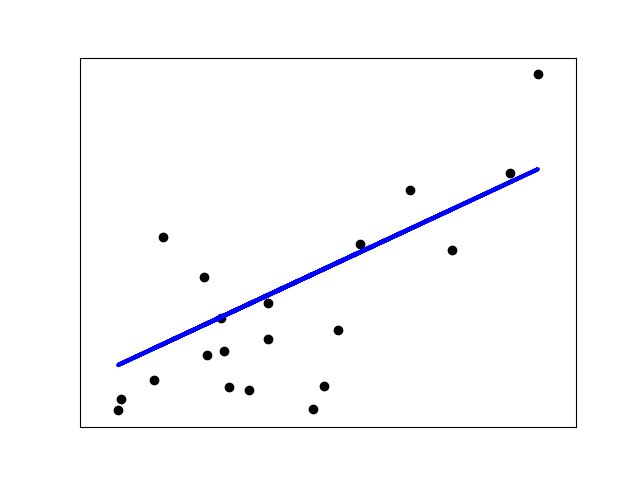
Which, I kid you not, is a line of best fit given a set of observations. If you've been fitting lines on data in Excel and seeing the R-squared values returned, you've technically been doing machine learning. Congrats! 😊
scikit-learn.org/stable/auto_ex…

M is for... Mask R-CNN!
This algorithm does image segmentation (picking out regions of interest in images, like different human beings or items), and is built on top of Fast R-CNN (the "F" example we saw earlier).
Paper: arxiv.org/pdf/1703.06870…
Code: github.com/facebookresear…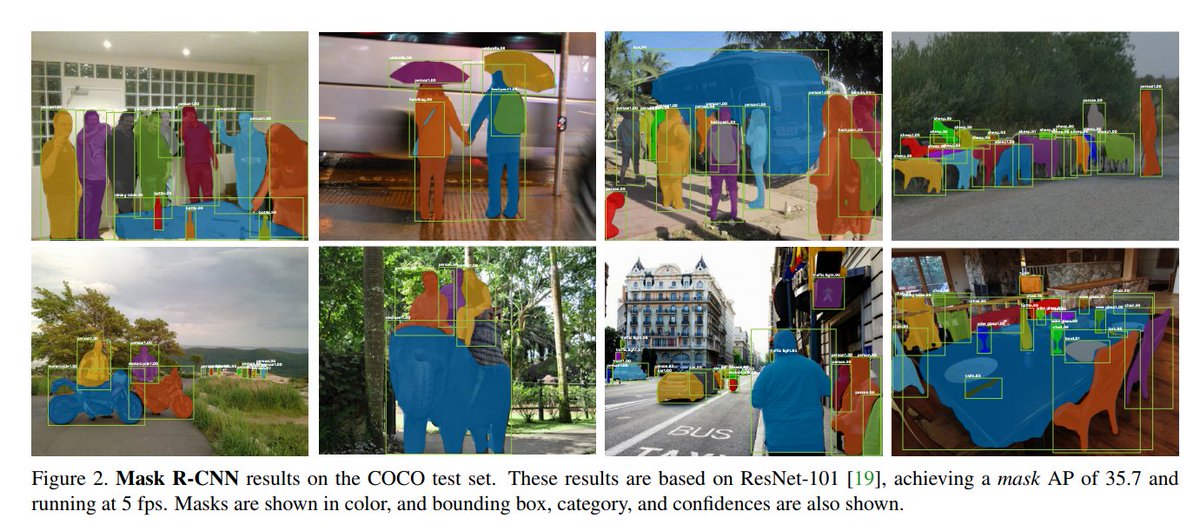
This algorithm does image segmentation (picking out regions of interest in images, like different human beings or items), and is built on top of Fast R-CNN (the "F" example we saw earlier).
Paper: arxiv.org/pdf/1703.06870…
Code: github.com/facebookresear…

N is for... Naïve Bayes!
NB methods are a set of supervised learning algorithms based on applying Bayes’ theorem with the “naive” assumption of independence between every pair of features. Scikit-learn has a whole family of 'em!
scikit-learn.org/stable/modules…
cran.r-project.org/web/packages/n…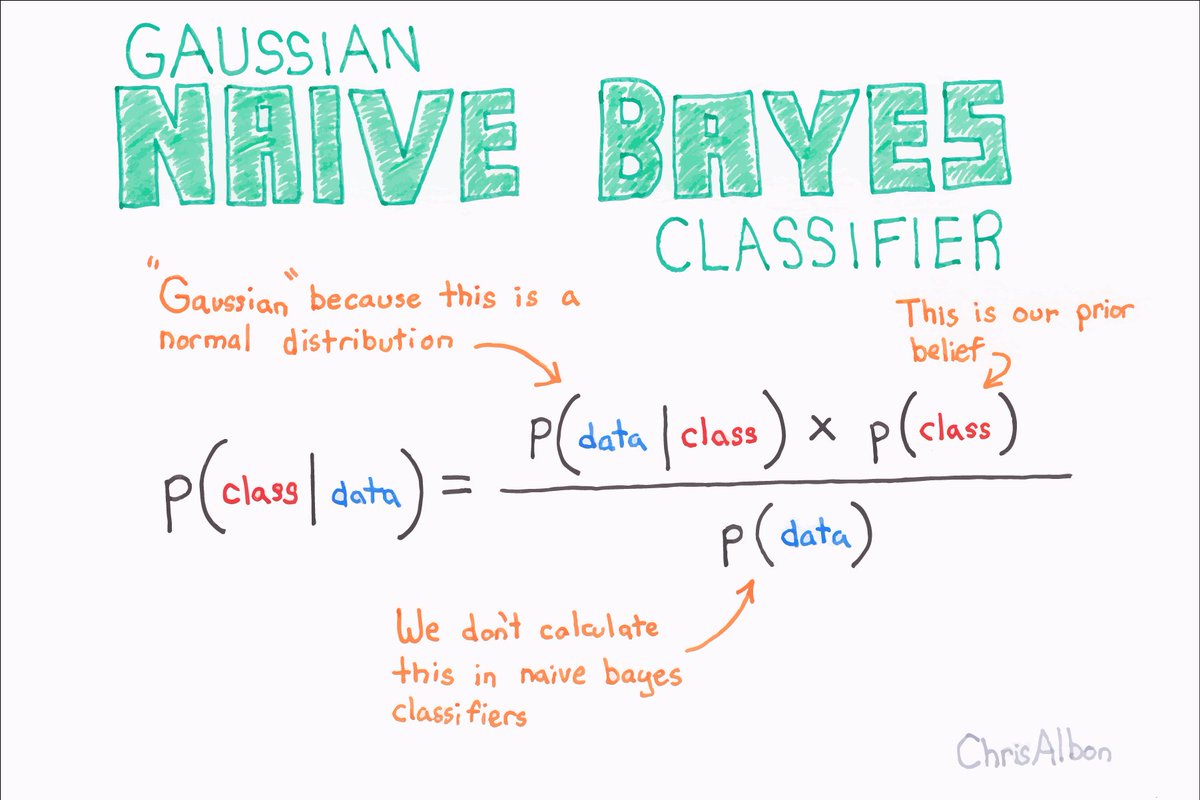
NB methods are a set of supervised learning algorithms based on applying Bayes’ theorem with the “naive” assumption of independence between every pair of features. Scikit-learn has a whole family of 'em!
scikit-learn.org/stable/modules…
cran.r-project.org/web/packages/n…

O is for... Out-of-core classification of text documents!
Full disclosure: this is something I haven't played with, but now I kinda want to. With OOCC, you can learn from data that doesn't fit into main memory. Love finding new @scikit_learn tools!
scikit-learn.org/stable/auto_ex…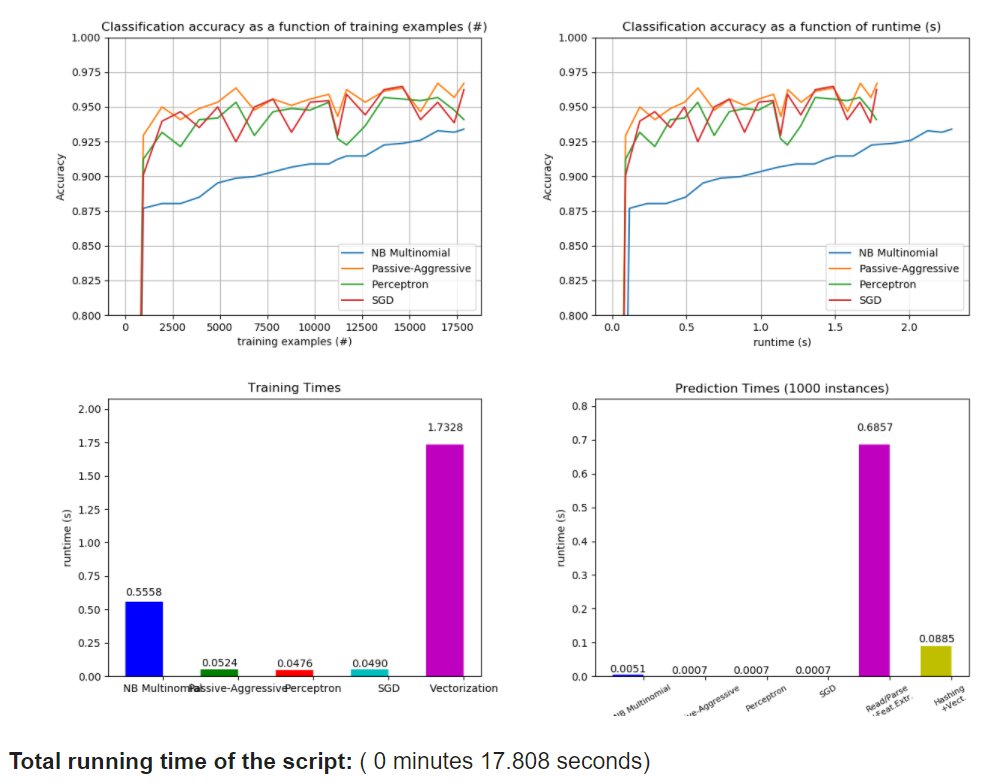
Full disclosure: this is something I haven't played with, but now I kinda want to. With OOCC, you can learn from data that doesn't fit into main memory. Love finding new @scikit_learn tools!
scikit-learn.org/stable/auto_ex…

P is for... Principal Components Analysis (PCA)!
This method uses an orthogonal transformation to convert a set of observations of possibly correlated variables into a set of values of linearly uncorrelated variables called principal components.
scikit-learn.org/stable/modules…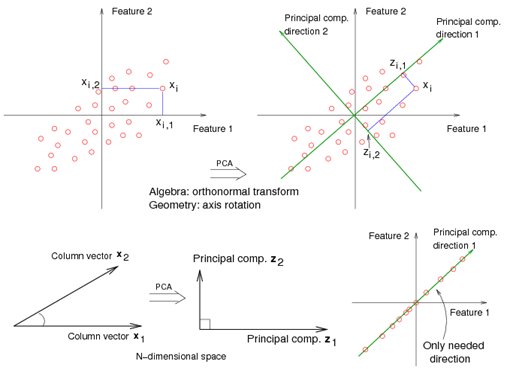
This method uses an orthogonal transformation to convert a set of observations of possibly correlated variables into a set of values of linearly uncorrelated variables called principal components.
scikit-learn.org/stable/modules…

Q is for... Quadratic Discriminant Analysis!
This is a classifier with a quadratic decision boundary, generated by fitting class conditional densities to the data & using Bayes’ rule. The model fits a Gaussian density to each class. Compare to Linear DA.
scikit-learn.org/stable/modules…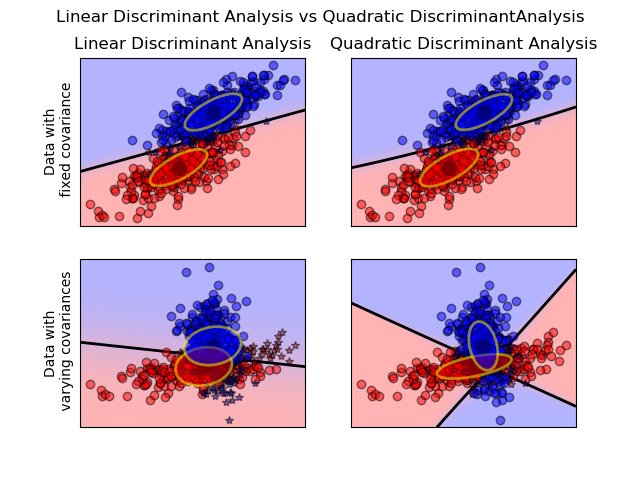
This is a classifier with a quadratic decision boundary, generated by fitting class conditional densities to the data & using Bayes’ rule. The model fits a Gaussian density to each class. Compare to Linear DA.
scikit-learn.org/stable/modules…

R is for... @Microsoft's ResNet!
152 layer deep convolutional neural network architecture that set new records in classification, detection, and localization - and has an error rate of 3.6%. Good going, @MSFTResearch Asia!
arxiv.org/pdf/1512.03385…
152 layer deep convolutional neural network architecture that set new records in classification, detection, and localization - and has an error rate of 3.6%. Good going, @MSFTResearch Asia!
arxiv.org/pdf/1512.03385…
S is for... Shake-Shake Regularization!
Motivation: resolve overfitting. Applied to 3-branch residual networks, shake-shake regularization improves on the best single shot published results on CIFAR-10+CIFAR100 by reaching test errors of 2.86% & 15.85%.
arxiv.org/pdf/1705.07485…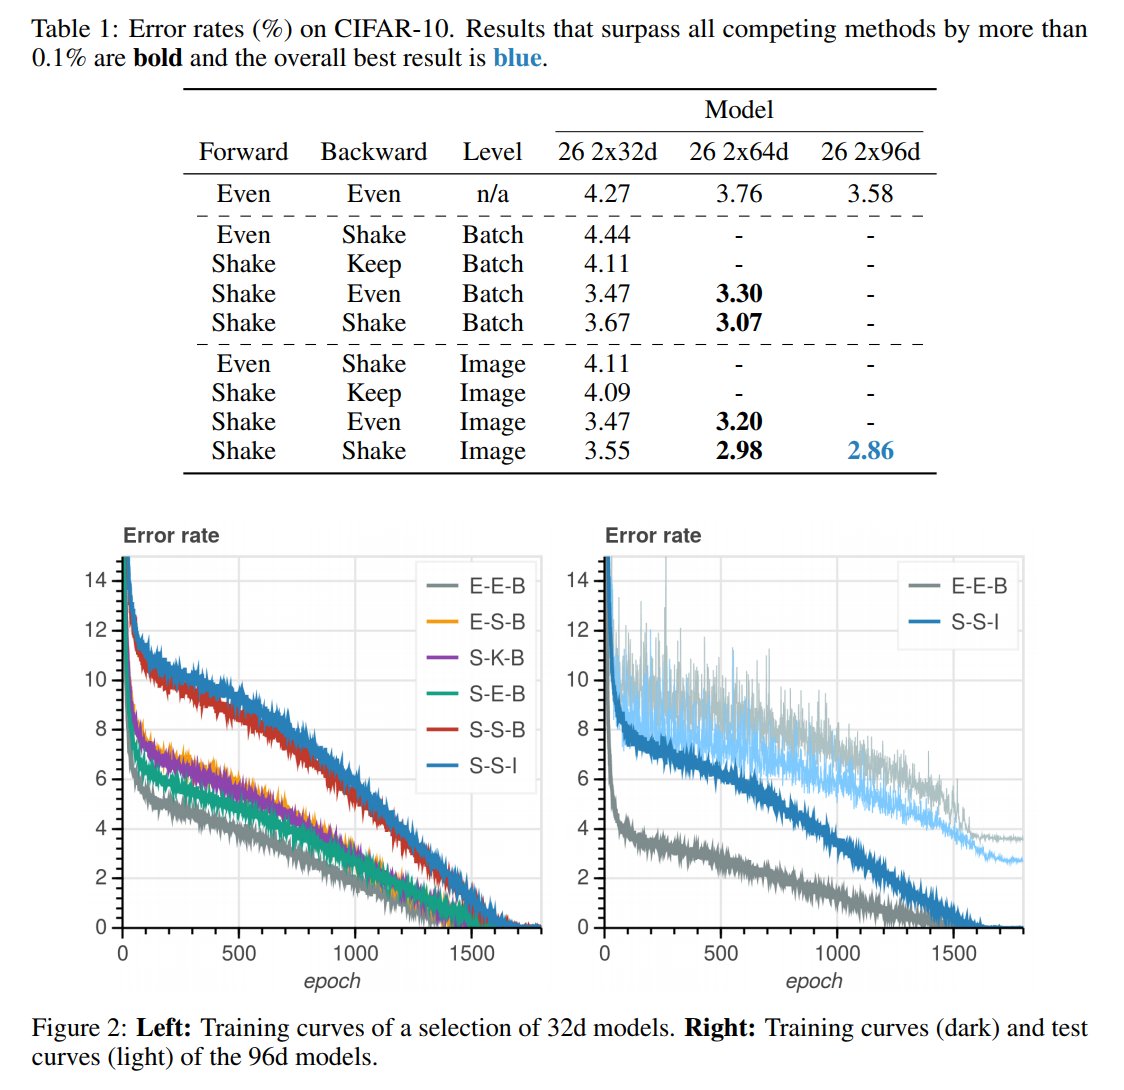
Motivation: resolve overfitting. Applied to 3-branch residual networks, shake-shake regularization improves on the best single shot published results on CIFAR-10+CIFAR100 by reaching test errors of 2.86% & 15.85%.
arxiv.org/pdf/1705.07485…

T is for... @GoogleBrain's Transformer!
Performs a small, constant # of steps (chosen empirically) for machine translation. Applies a self-attention mechanism which models relationships between all words in a sentence, regardless of respective position.
research.googleblog.com/2017/08/transf…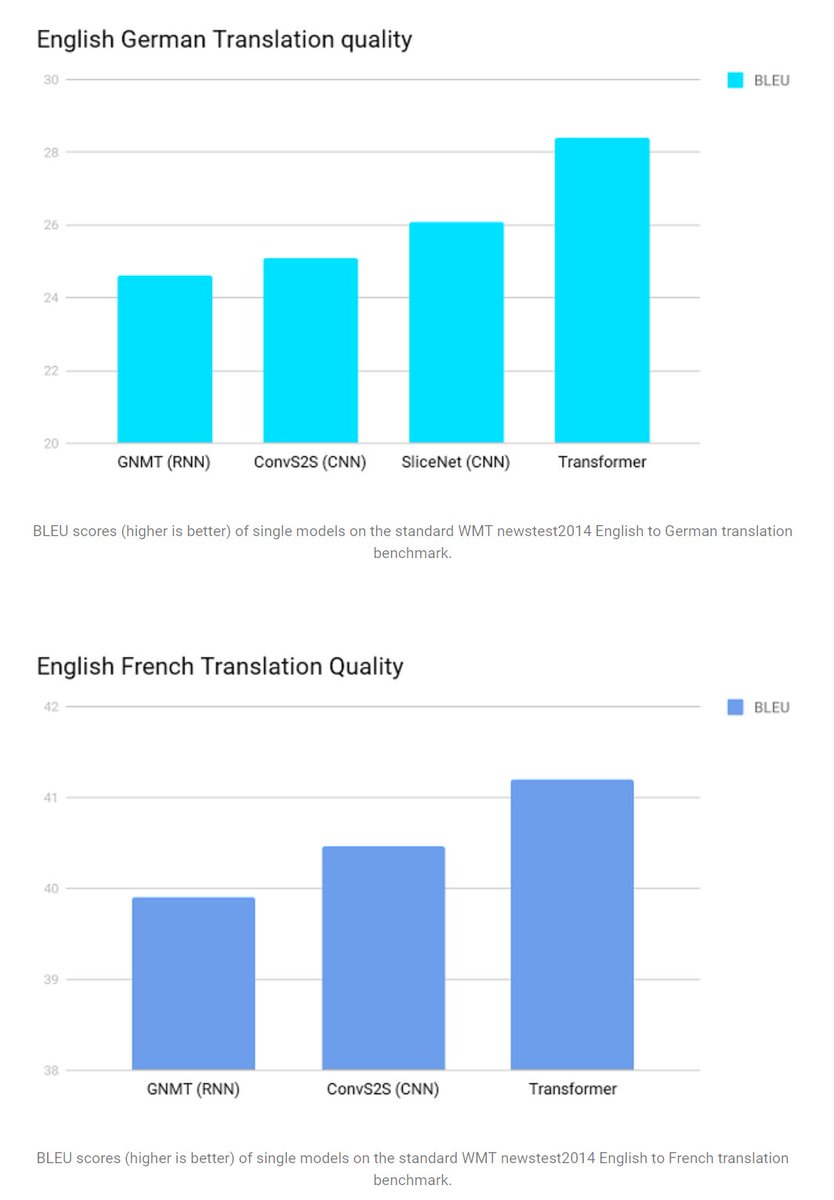
Performs a small, constant # of steps (chosen empirically) for machine translation. Applies a self-attention mechanism which models relationships between all words in a sentence, regardless of respective position.
research.googleblog.com/2017/08/transf…

U is for... Uh. *cough* sUpport Vector Machines? *cough*
Set of supervised learning methods used for classification, regression and outliers detection. Effective in high-dimensional spaces, and quite versatile - though have lost popularity recently.
scikit-learn.org/stable/modules…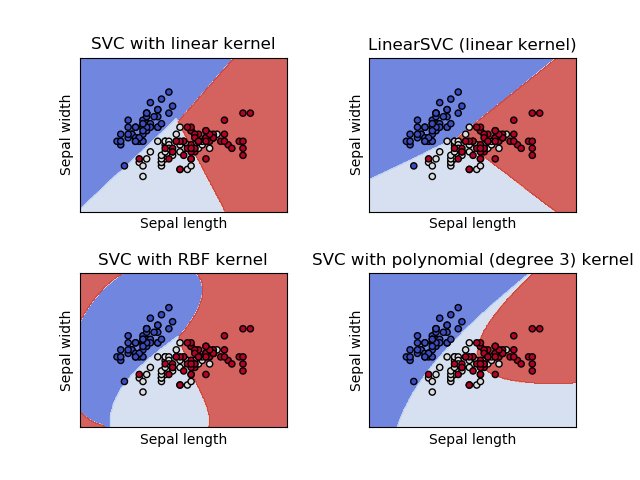
Set of supervised learning methods used for classification, regression and outliers detection. Effective in high-dimensional spaces, and quite versatile - though have lost popularity recently.
scikit-learn.org/stable/modules…

V is for... VGG Net!
Reinforced the notion that convolutional neural networks have to have a deep network of layers in order for the hierarchical representation of visual data to work. 7.3% error rate in 2014, which isn't bad!
arxiv.org/pdf/1409.1556v…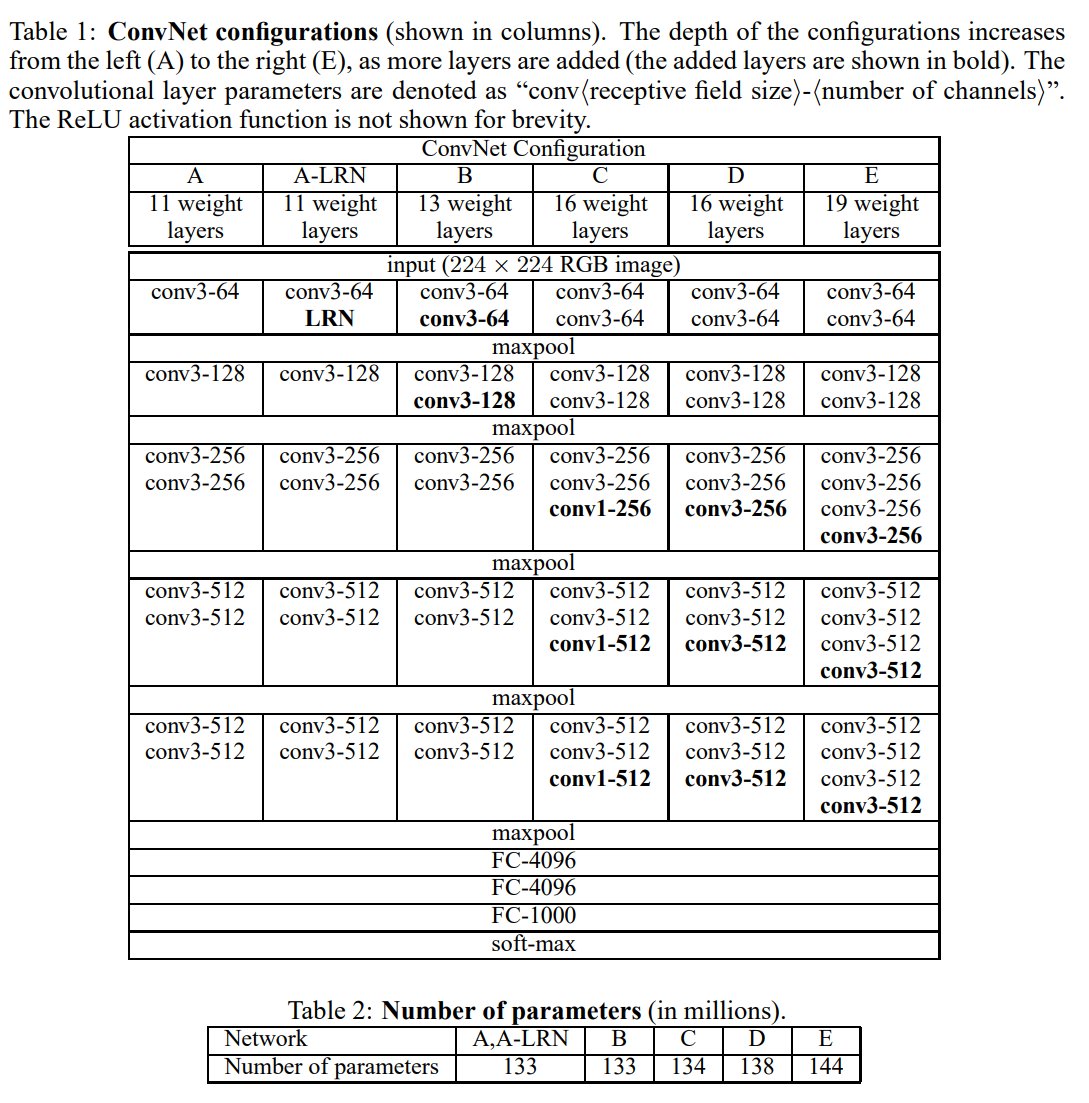
Reinforced the notion that convolutional neural networks have to have a deep network of layers in order for the hierarchical representation of visual data to work. 7.3% error rate in 2014, which isn't bad!
arxiv.org/pdf/1409.1556v…

W is for... Wake-Sleep Algorithm!
Unsupervised; for a stochastic multilayer neural network. Adjusts parameters to produce a good density estimator. There are two learning phases, the “wake” phase and the “sleep” phase, which are performed alternately.
cs.toronto.edu/~fritz/absps/w…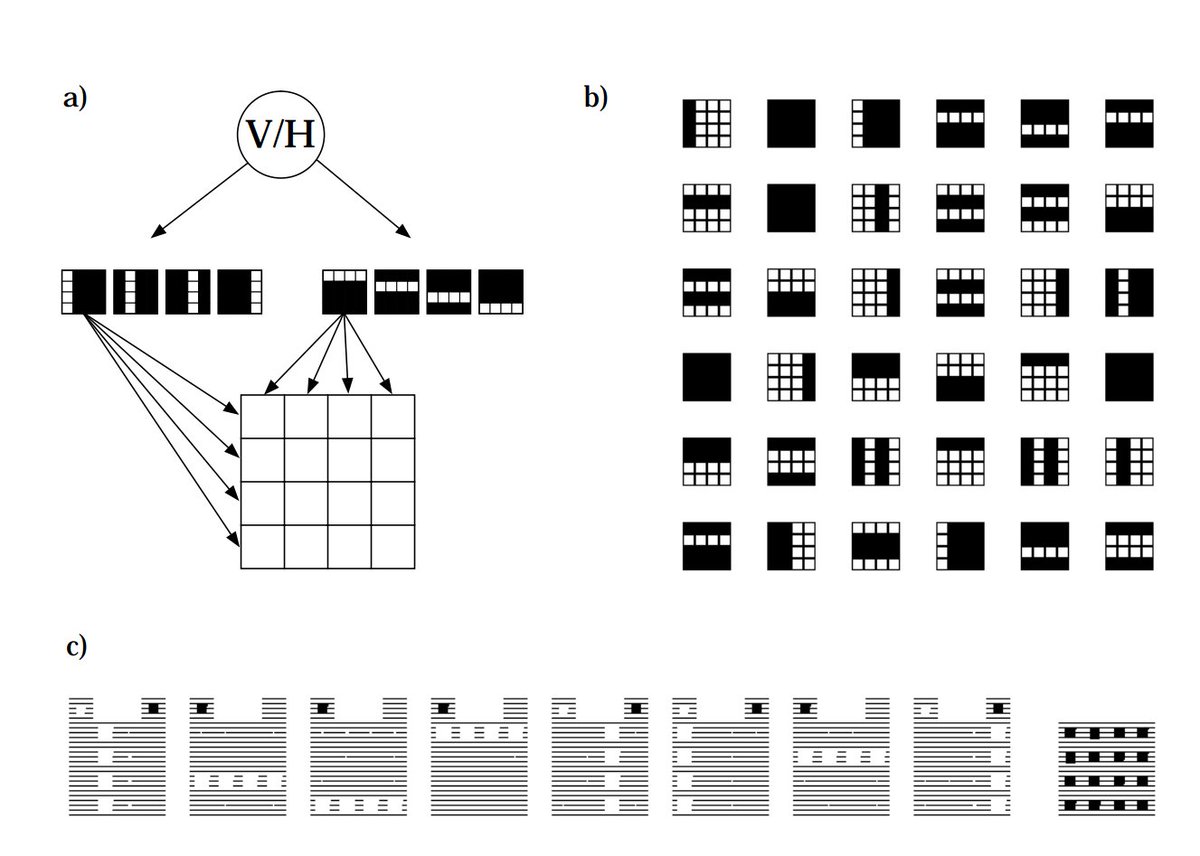
Unsupervised; for a stochastic multilayer neural network. Adjusts parameters to produce a good density estimator. There are two learning phases, the “wake” phase and the “sleep” phase, which are performed alternately.
cs.toronto.edu/~fritz/absps/w…

X is for... eXpectation Maximization!
Iterative method to find maximum likelihood or maximum a posteriori (MAP) estimates of parameters in statistical models, where the model depends on unobserved latent variables.
www2.ee.washington.edu/techsite/paper…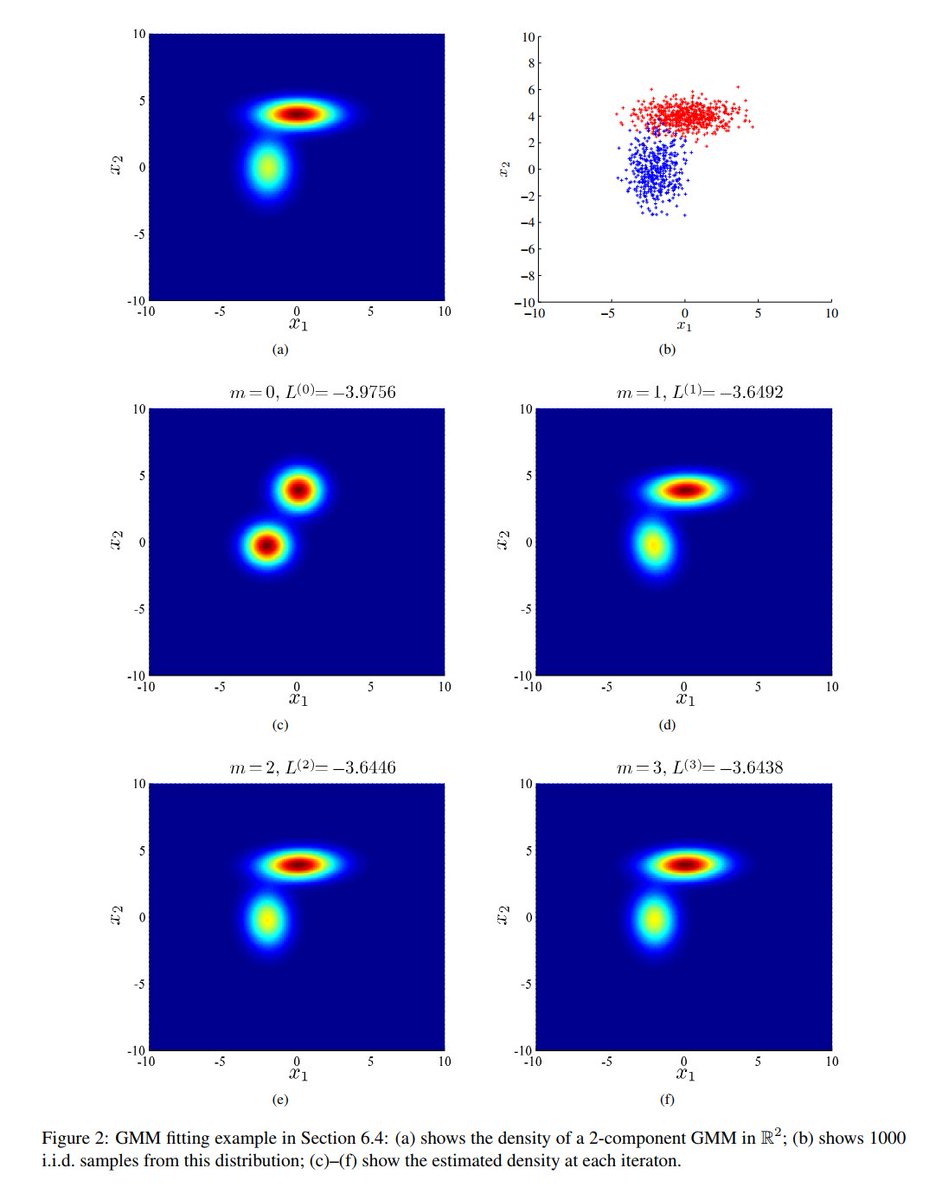
Iterative method to find maximum likelihood or maximum a posteriori (MAP) estimates of parameters in statistical models, where the model depends on unobserved latent variables.
www2.ee.washington.edu/techsite/paper…

Y is for...
YELLING AT THE COMPUTER
(sometimes it works?)
YELLING AT THE COMPUTER
(sometimes it works?)
Z is for... ZFNet!
Old school (2013); trained for 12 days on 1.3M images; achieved ~11% error rate. Similar to AlexNet (15M). Used ReLUs for activation functions, cross-entropy loss for error function, & trained using batch stochastic gradient descent.
arxiv.org/pdf/1311.2901v…
Old school (2013); trained for 12 days on 1.3M images; achieved ~11% error rate. Similar to AlexNet (15M). Used ReLUs for activation functions, cross-entropy loss for error function, & trained using batch stochastic gradient descent.
arxiv.org/pdf/1311.2901v…

Whew! That was fun. 😊
Keep an eye on this thread! There are so many #MachineLearning & #DeepLearning models I haven't added yet, and so many waiting to be created. Will also add links to papers as they're placed on @arxiv_org and research blogs.
Learn like you'll live forever!
Keep an eye on this thread! There are so many #MachineLearning & #DeepLearning models I haven't added yet, and so many waiting to be created. Will also add links to papers as they're placed on @arxiv_org and research blogs.
Learn like you'll live forever!
• • •
Missing some Tweet in this thread? You can try to
force a refresh


