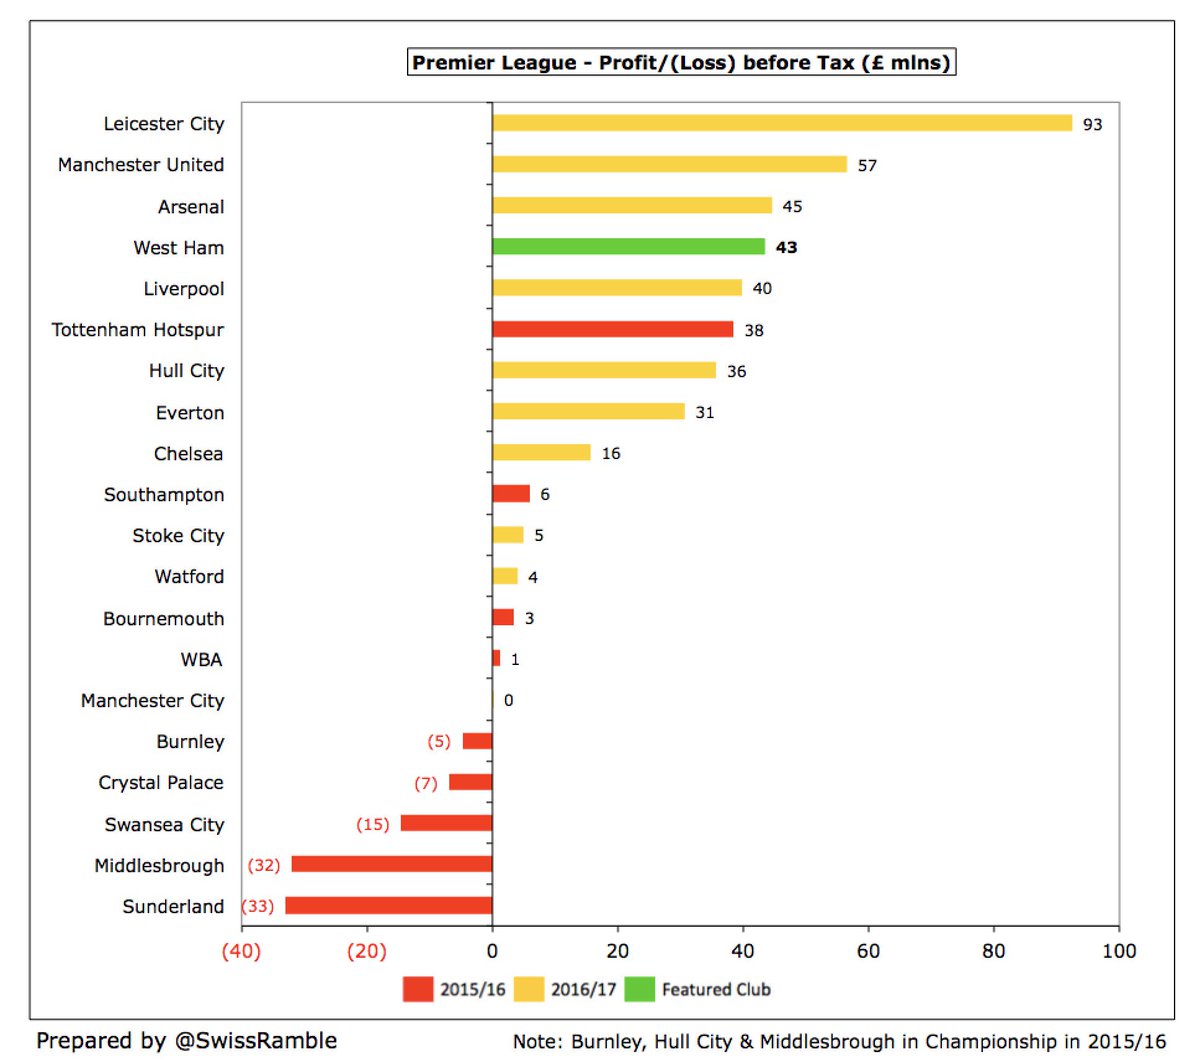
West Ham’s 2016/17 financial results covered their first season in the new London Stadium. Despite dropping to 11th place in the Premier League, they reported record revenue and profit. Some thoughts in the following thread #WHUFC
#WHUFC improved the bottom line by £48m, as they converted a £5m loss to £43m profit with revenue growing by 29% (£41m) to £183m. Profit on player sales was up £24m, mainly due to transfers of Dimitri Payet to Marseille and James Tomkins to Crystal Palace. 
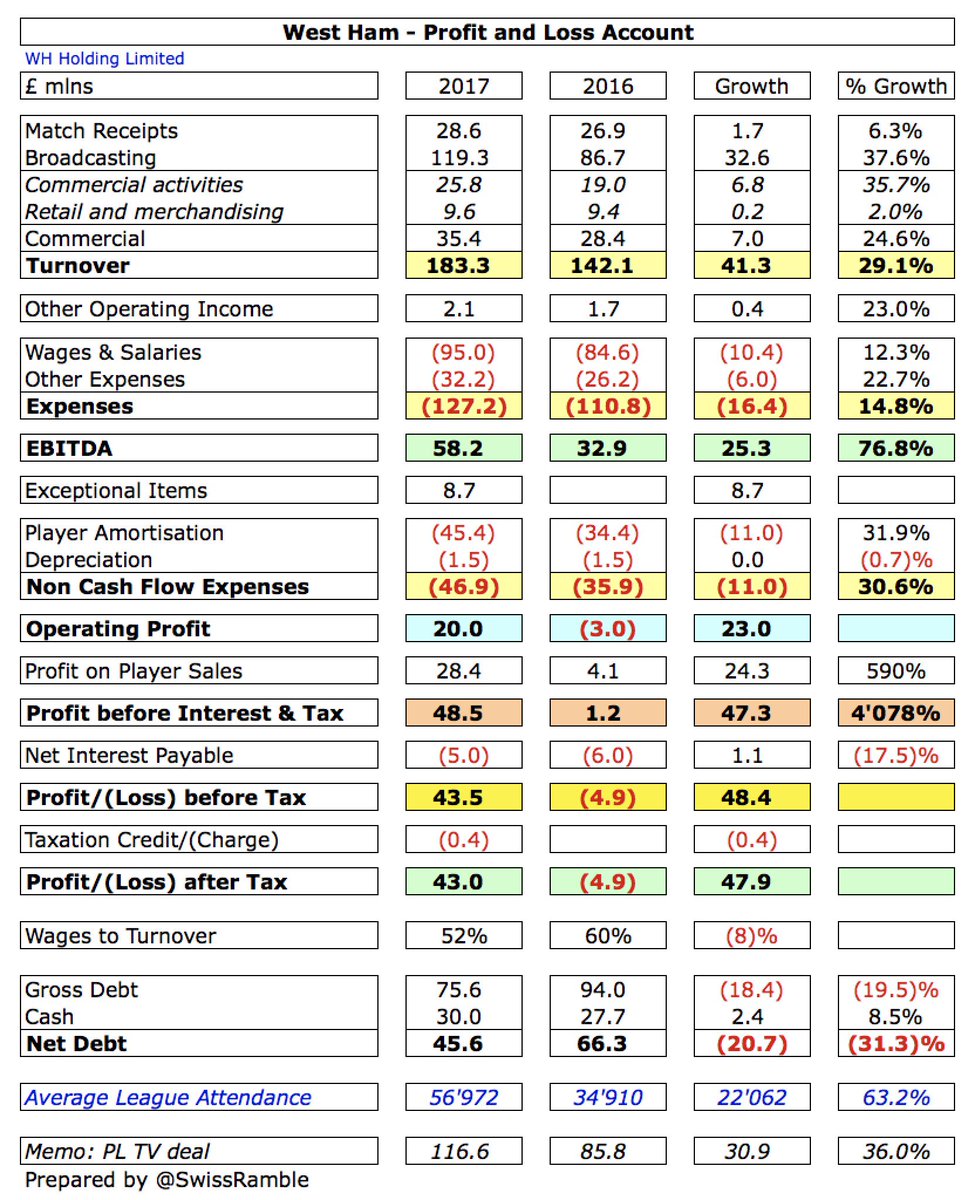
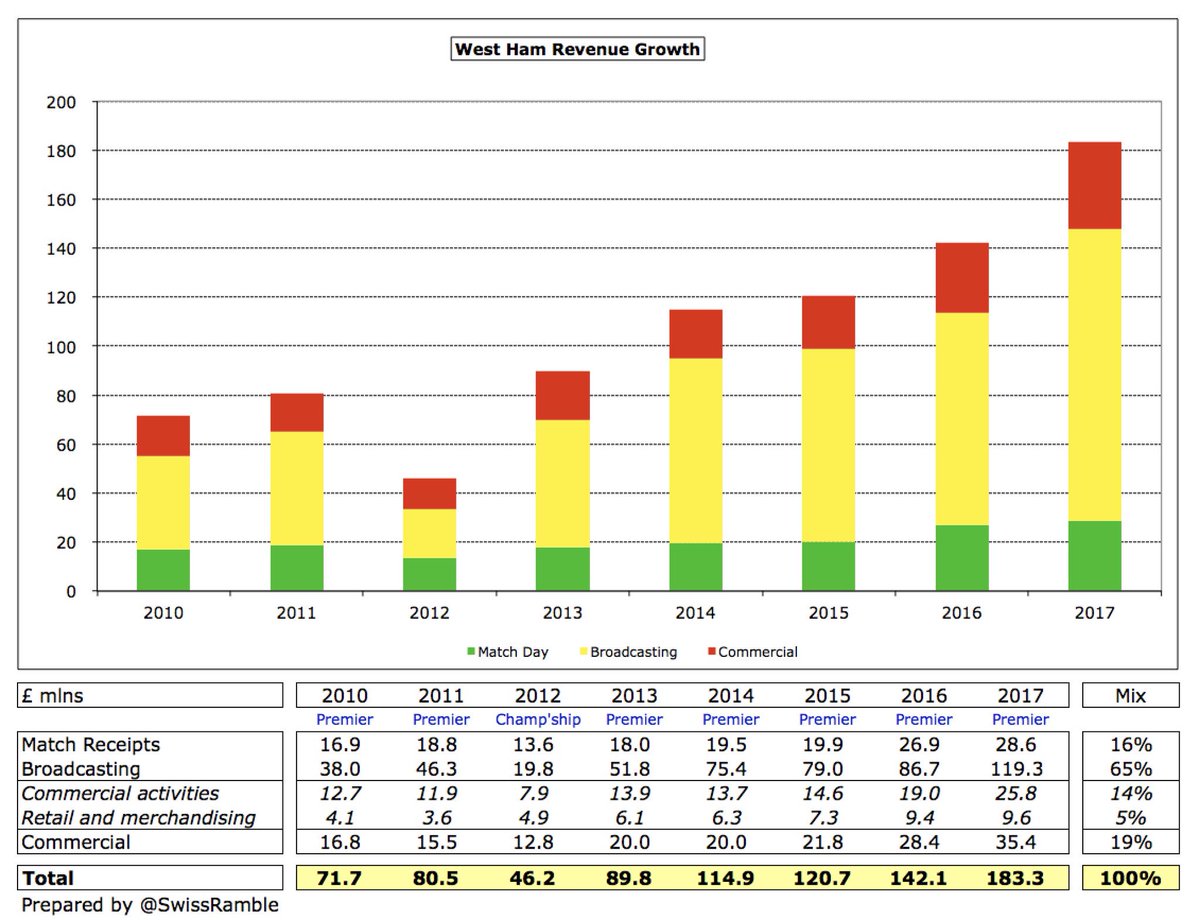
#WHUFC revenue growth was driven by the new Premier League TV deal with a net increase in broadcasting income of £33m (38%) to £119m. Commercial income also rose by £7m (25%) to £35m, while match receipts were £2m (6%) higher in the new stadium at £29m. 
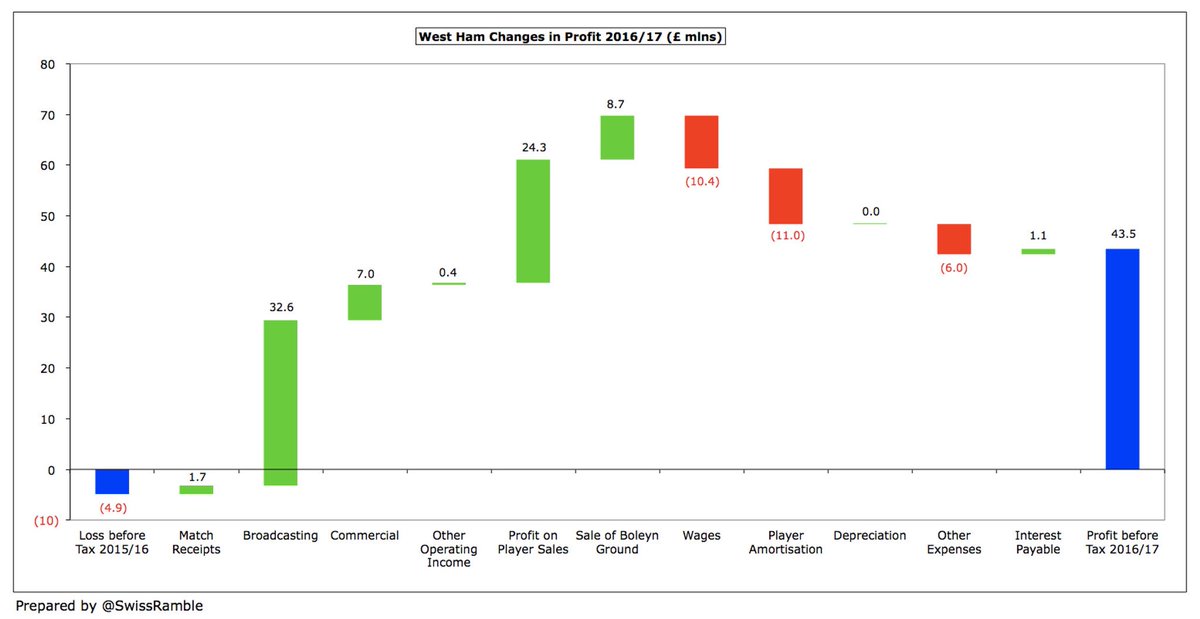
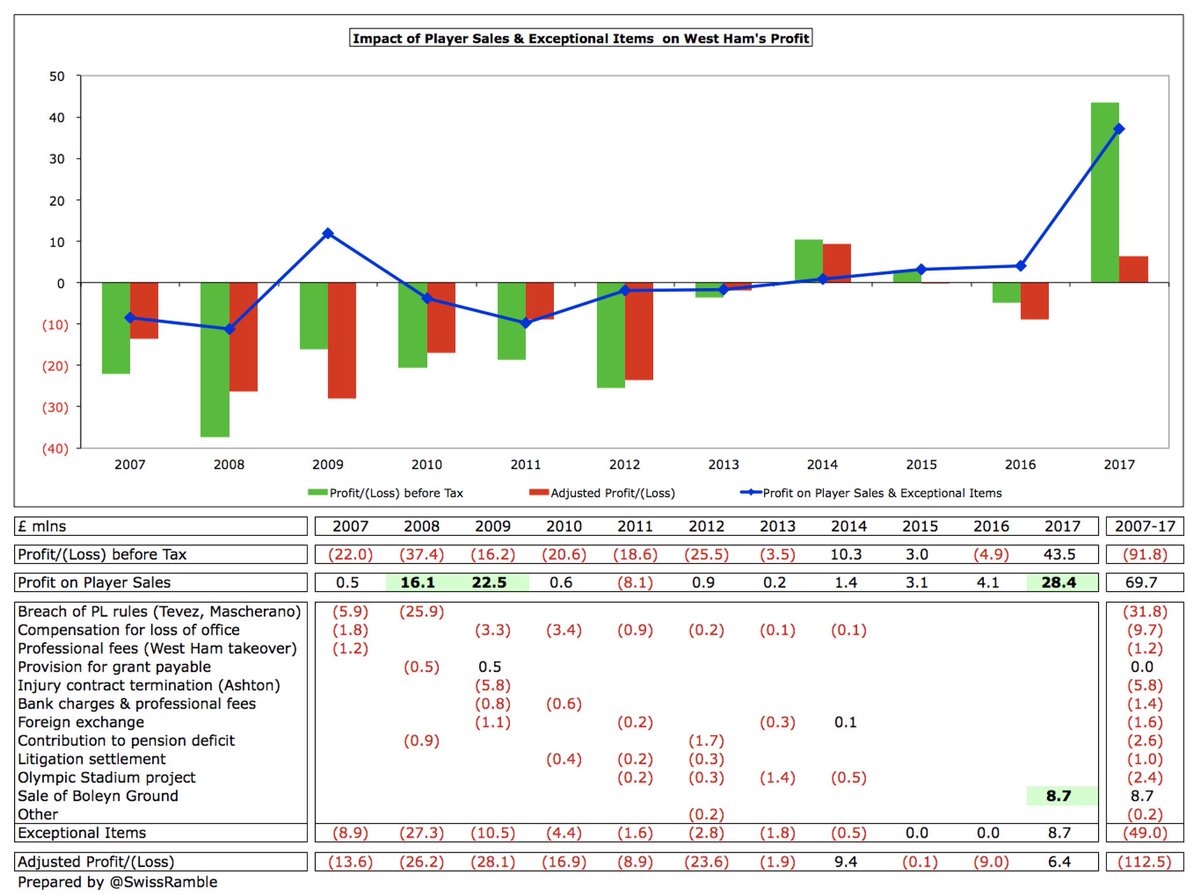
#WHUFC also benefited from an exceptional profit of £8.7m from the sale of the Boleyn Ground. This was sold for £38m compared to £30m value in the accounts plus another £0.7m came from the sale of various stadium assets.
On the other hand, #WHUFC saw some significant cost growth. Investment in the playing squad resulted in the wage bill growing by £10m (12%) to £95m and player amortisation increasing by £11m (32%) to £45m, while other expenses were also up £6m (23%).
#WHUFC £43m profit is very impressive (I reckon it’s the 9th best ever in the Premier League), but for some perspective all clubs that have published 2016/17 accounts to date are profitable. In fact, the club notes that 19 out of 20 Premier League clubs made a profit last season. 
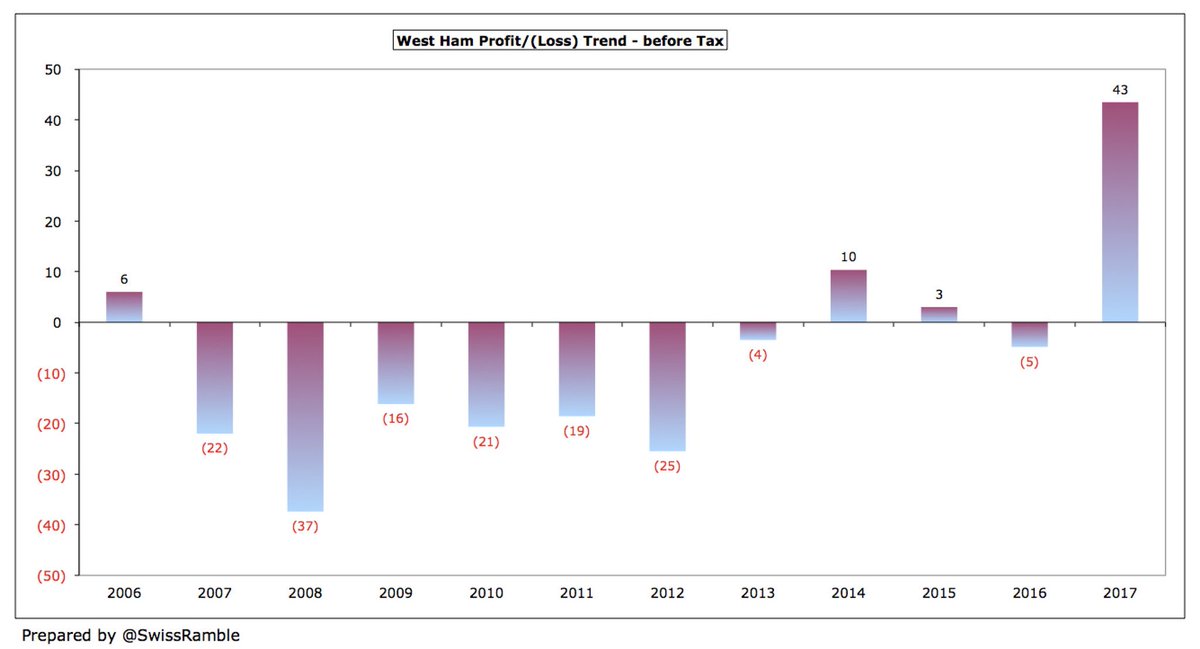
After a lengthy period of losses (summing to £143m in the seven years between 2007 and 2013), #WHUFC have now been profitable in three of the last four years (and the 2016 loss was less than £5m), though the 2017 profit of £43m is much higher than any previously reported figure. 
#WHUFC have rarely made big money from player sales until last season. In fact, the £28m registered in 2016/17 is higher than the money made from this activity for the previous 8 seasons combined. The adverse impact of numerous exceptional items seems to be a thing of the past. 
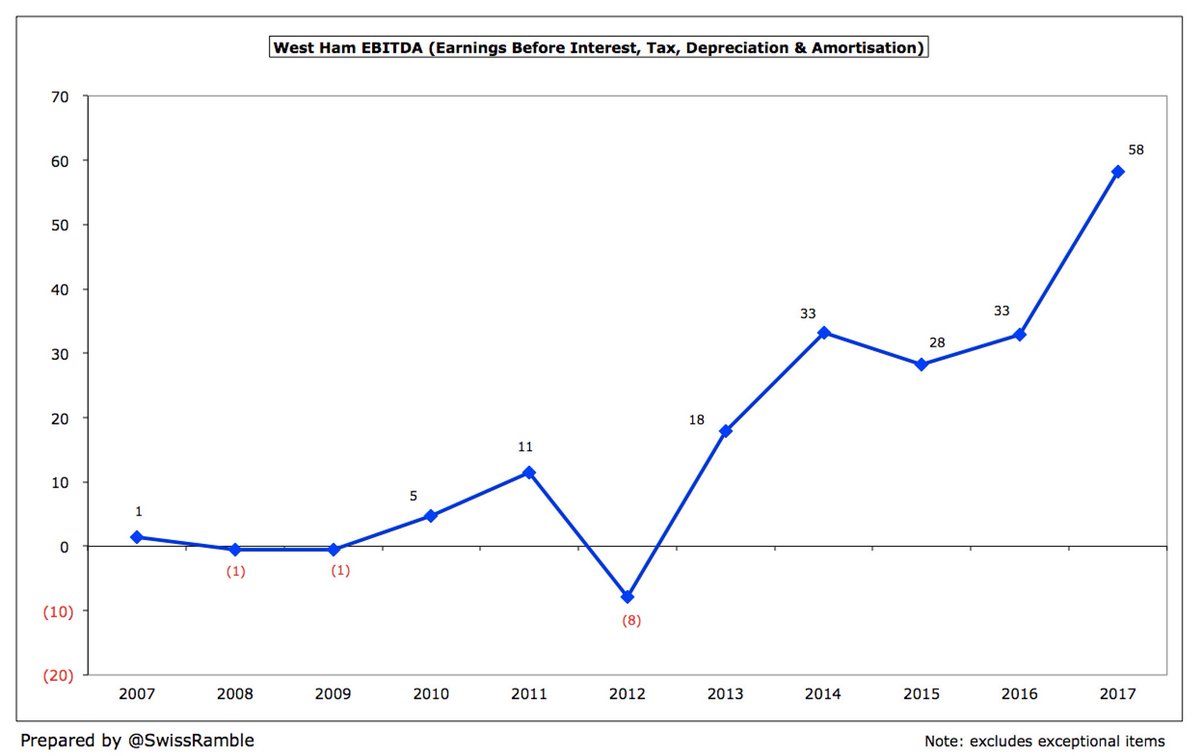
The last time that #WHUFC EBITDA (Earnings Before Interest, Tax, Depreciation & Amortisation), which can be considered as a proxy for cash operating profit, was negative was 2012, when they were in the Championship. Since then, it has steadily risen from £(8)m to £58m in 2017. 
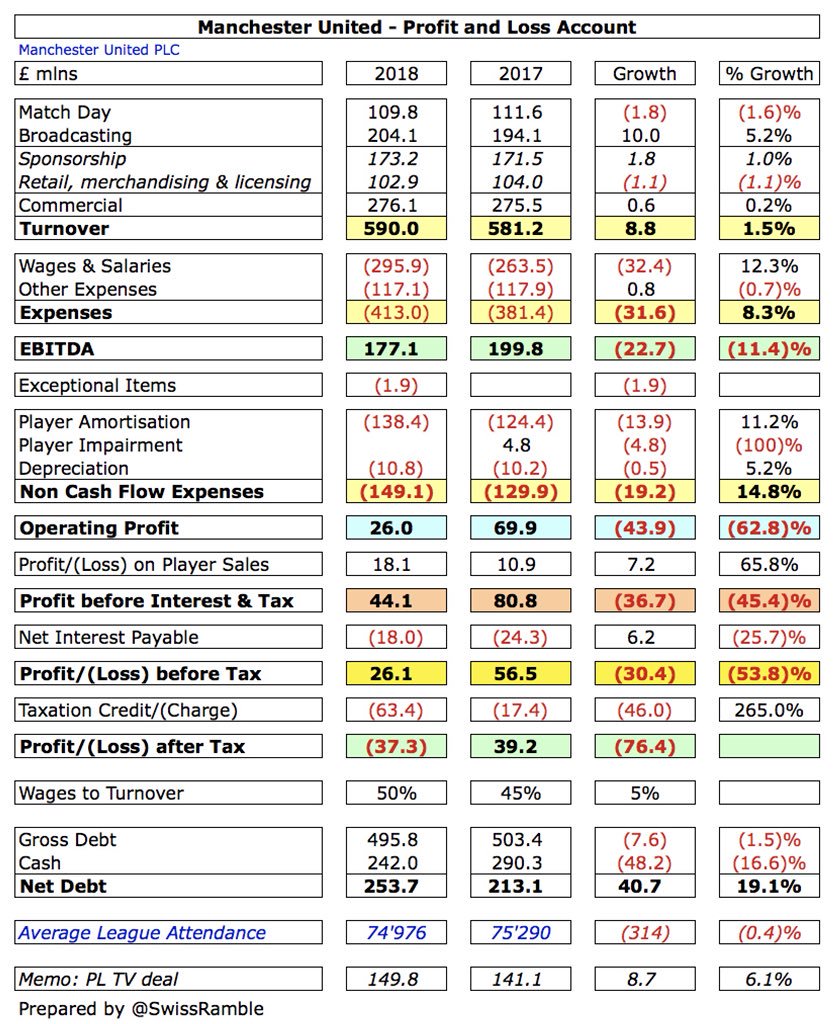
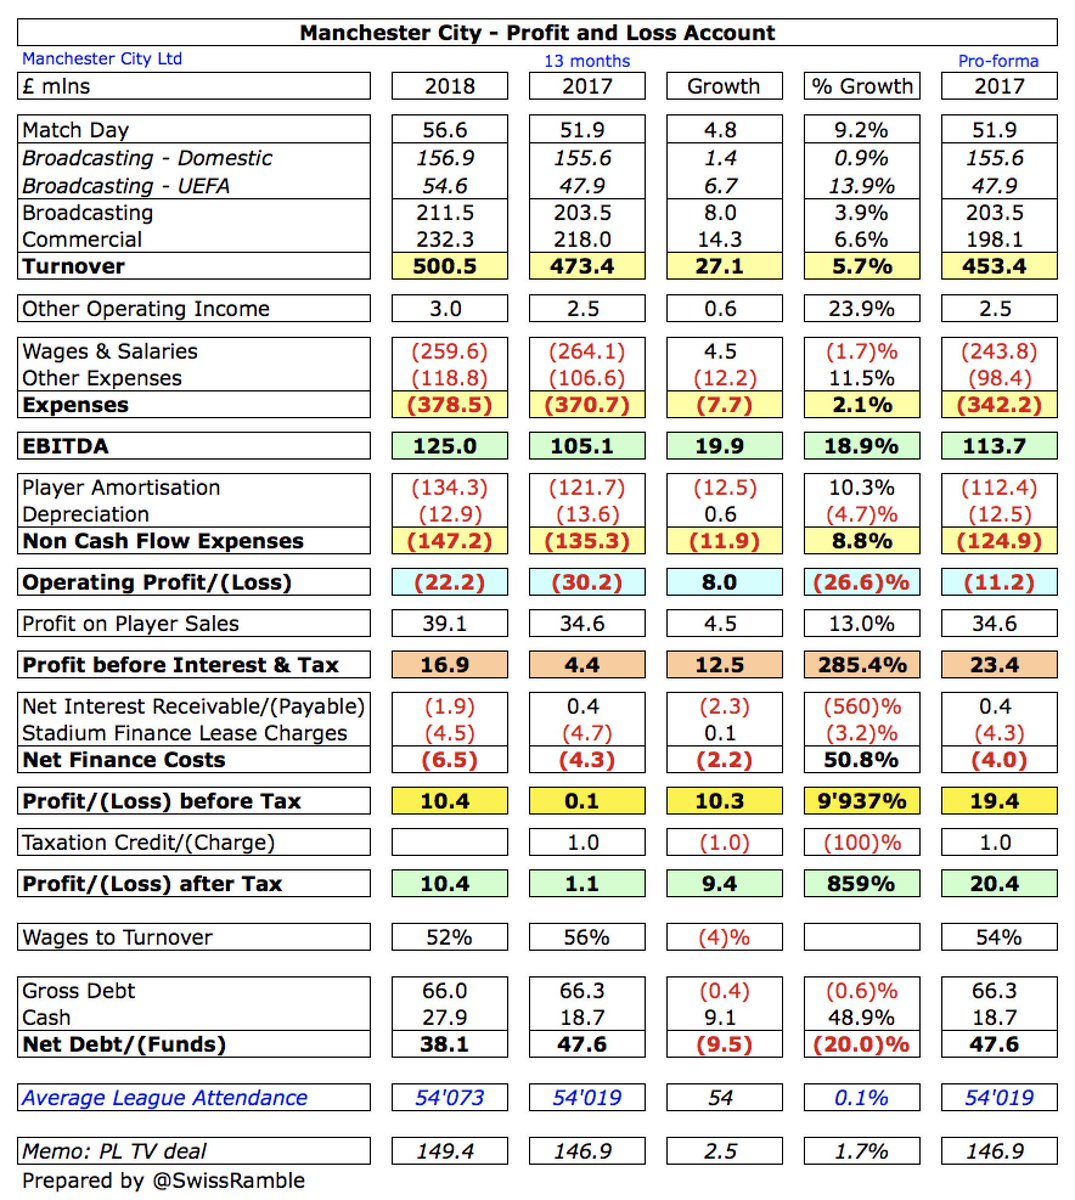
As a result of this solid growth, #WHUFC EBITDA of £58m is the fifth highest in the top flight (though may be overtaken by #THFC and #LCFC when they publish their 2016/17 accounts), only behind #MUFC £200m, #AFC £138m, #MCFC £105m and #LFC £72m. 

Since promotion from the Championship, #WHUFC revenue has increased four years in a row, more than doubling from the £90m in 2013 to £183m in 2017. Most of this (£67m) has been driven by TV money, which now contributes around two-thirds of total revenue. 
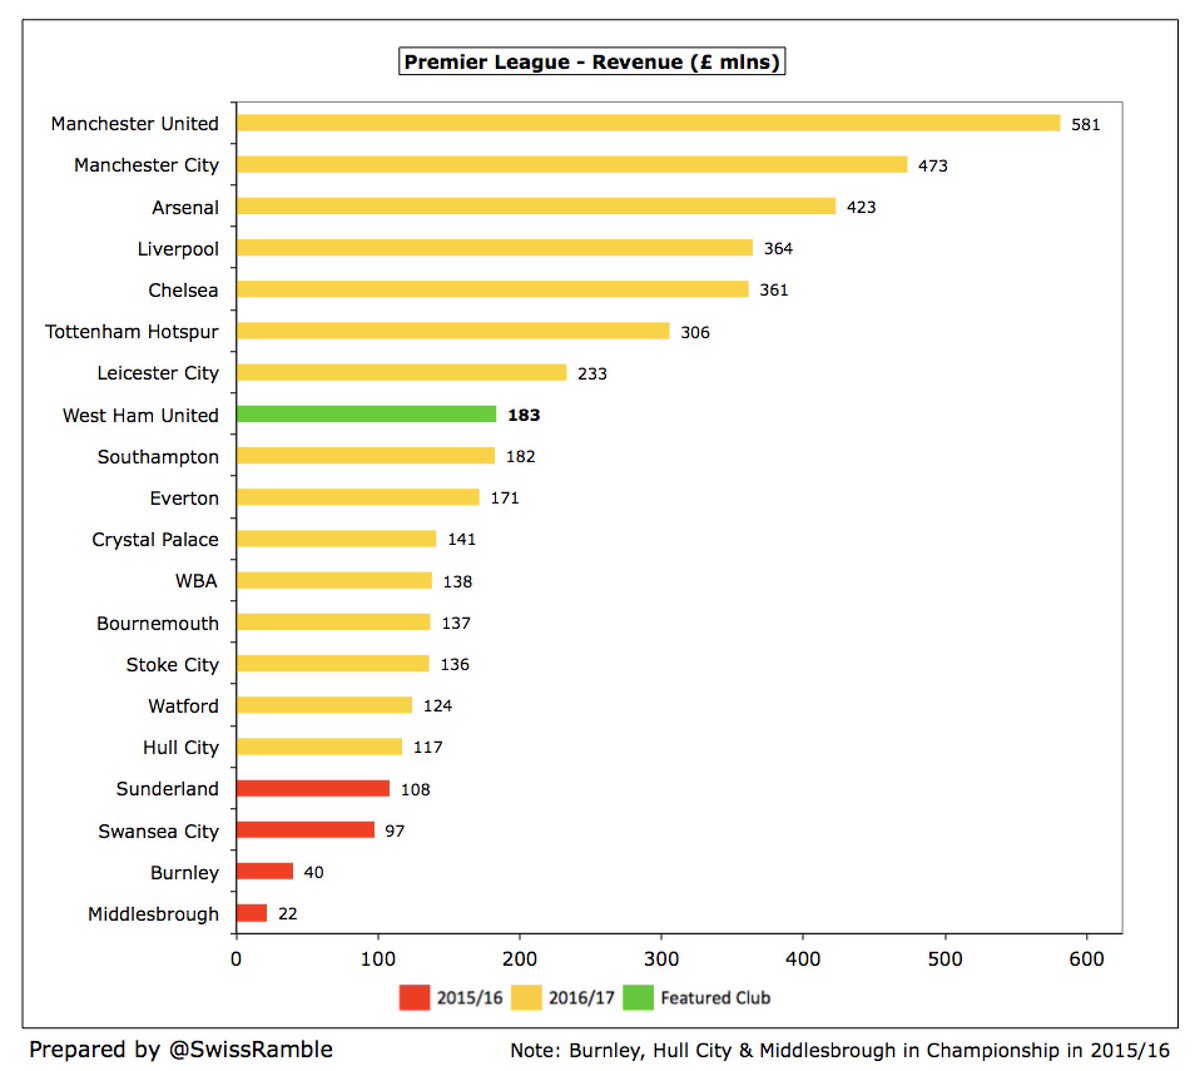
Following the steep increase in #WHUFC 2016/17 revenue of £183m is the 8th highest in the Premier League, only surpassed by the “Big Six” and Leicester, who were boosted by Champions League money. They are effectively the “best of the rest”, just ahead of Southampton & Everton. 
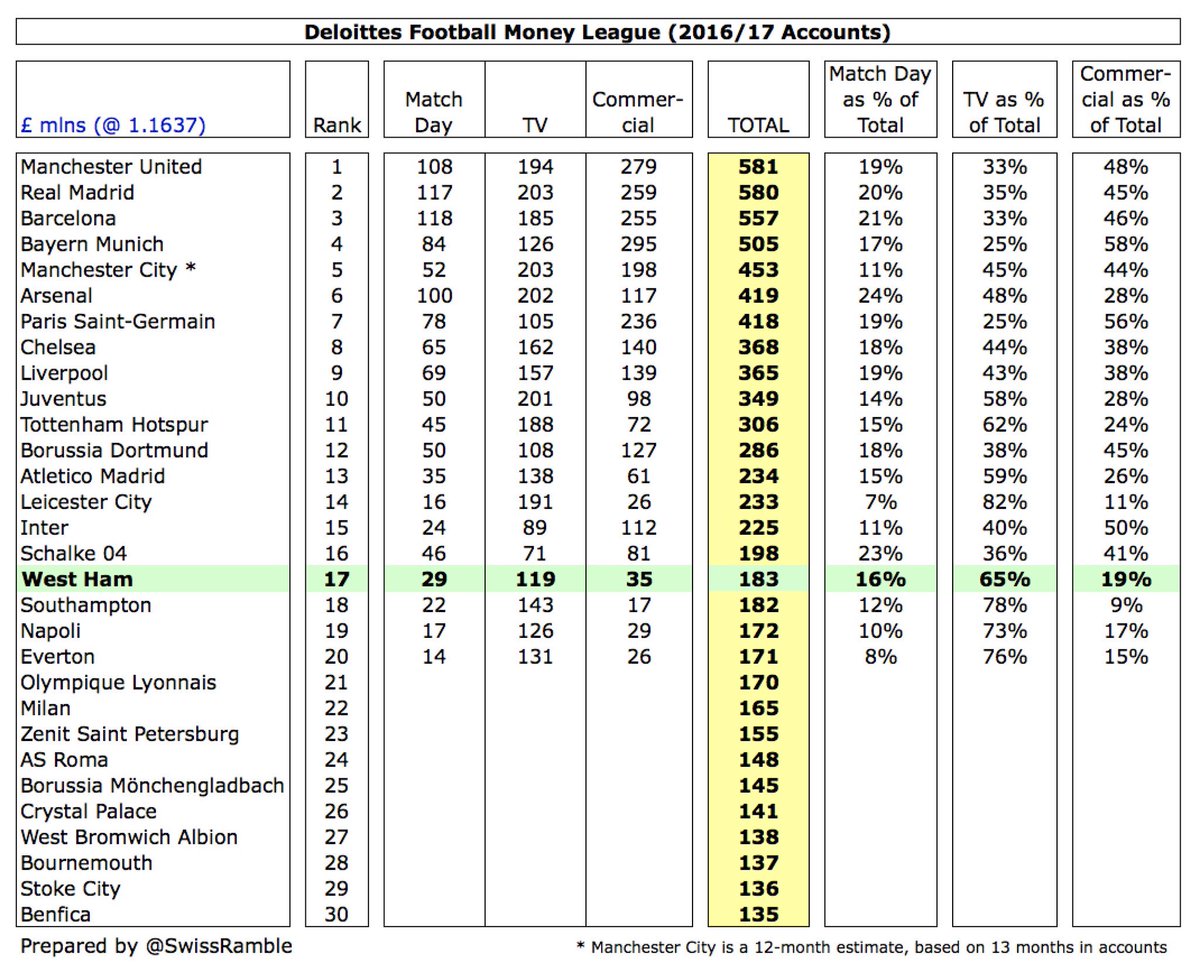
In fact, #WHUFC had the 17th highest revenue in the world in 2016/17 per the Deloitte Money League, largely due to the impact of the new Premier League TV deal. This is their highest ever position. 
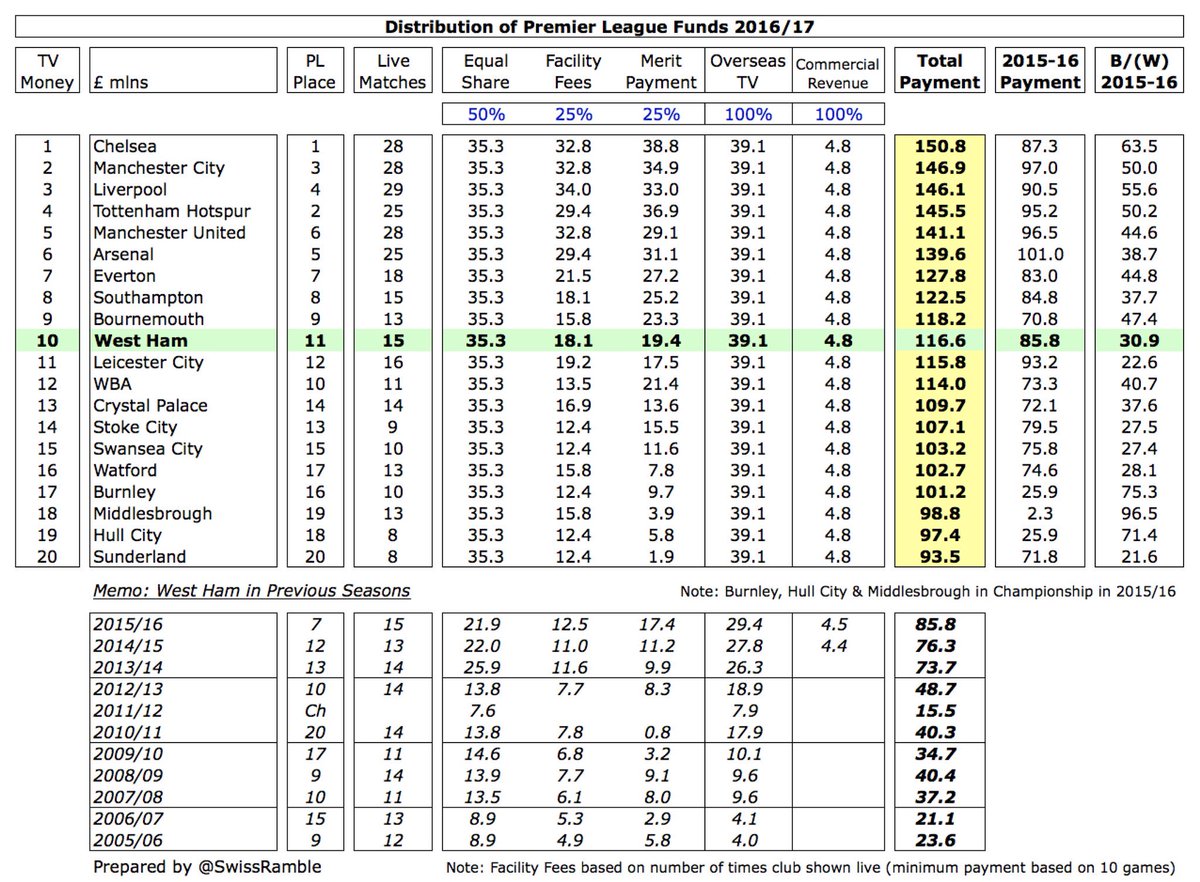
#WHUFC broadcasting income increased £33m from £86m to £119m due to the new Premier League three-year deal. This would have been £8m higher if they had repeated their 7th place finish in 2015/16. Obviously, all clubs in the top flight enjoyed similar growth. 
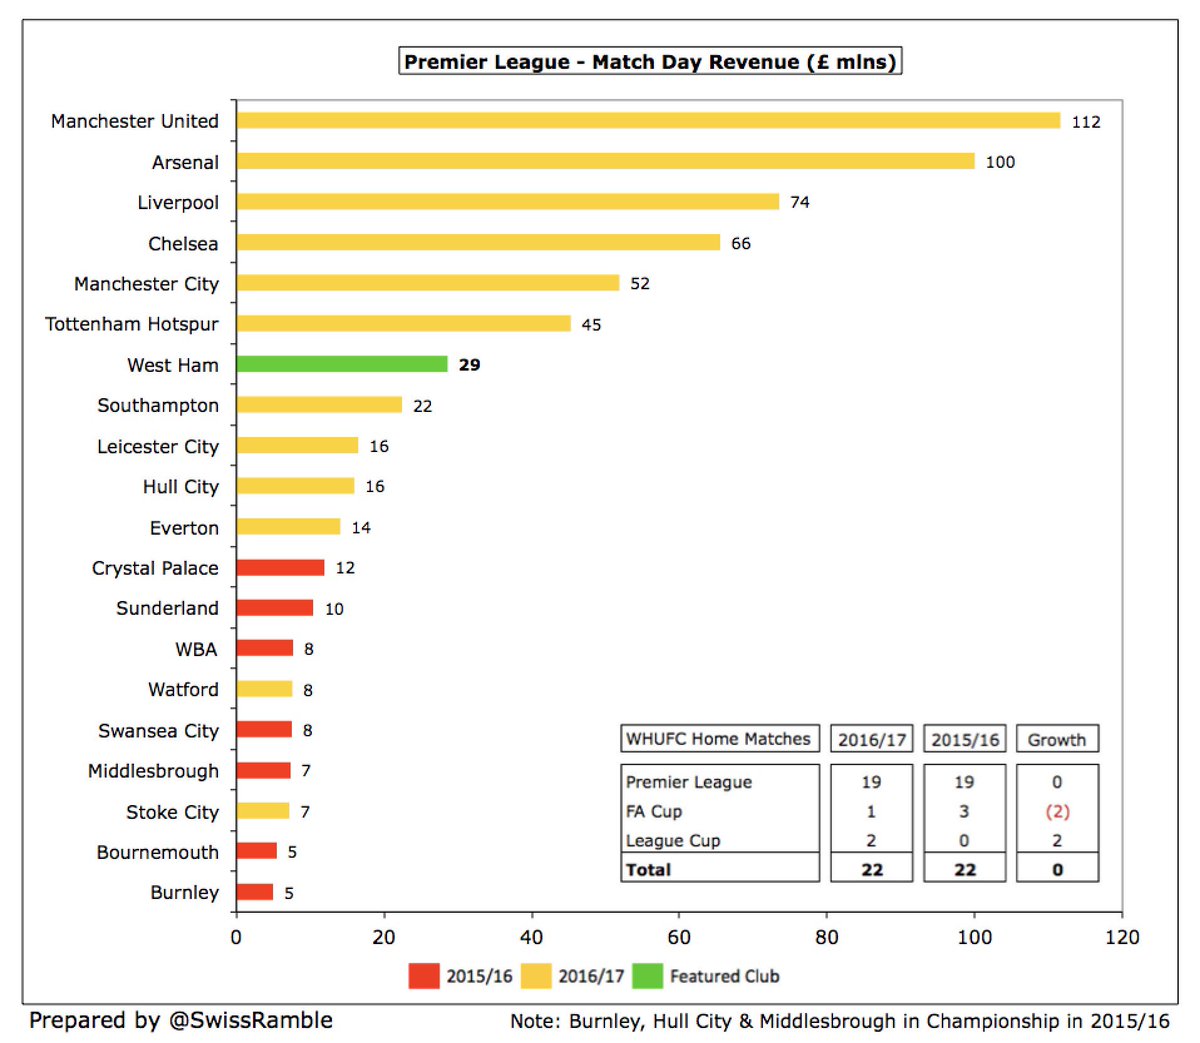
The move to the new London Stadium only increased #WHUFC match receipts by £1.7m (6%) from £26.9m to £28.6m, partly due to competitive pricing, partly because 2016 was inflated by the “farewell Boleyn excitement” (2015 was only £19.9m). Still a long way below the top six clubs. 
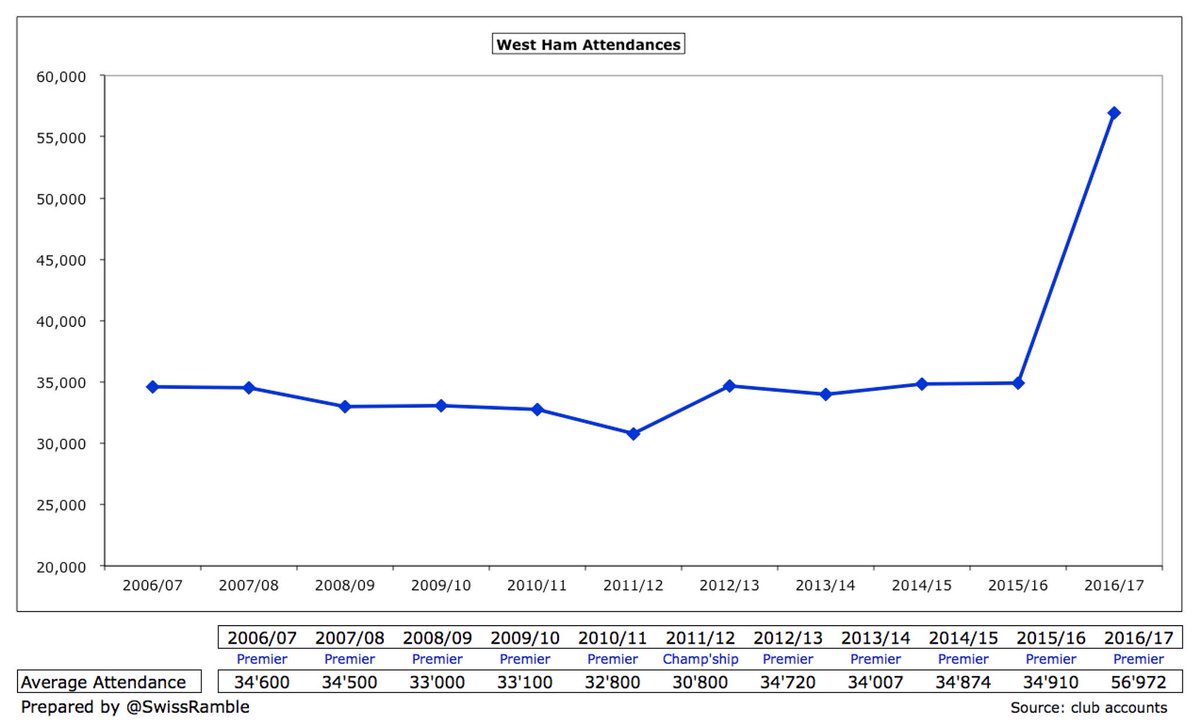
#WHUFC average attendance shot up from 34,910 to 56,972, though vice-chairman Karren Brady admitted, “the club would have made a similar profit had it remained at the old stadium”, which is not exactly what fans wanted to hear. 
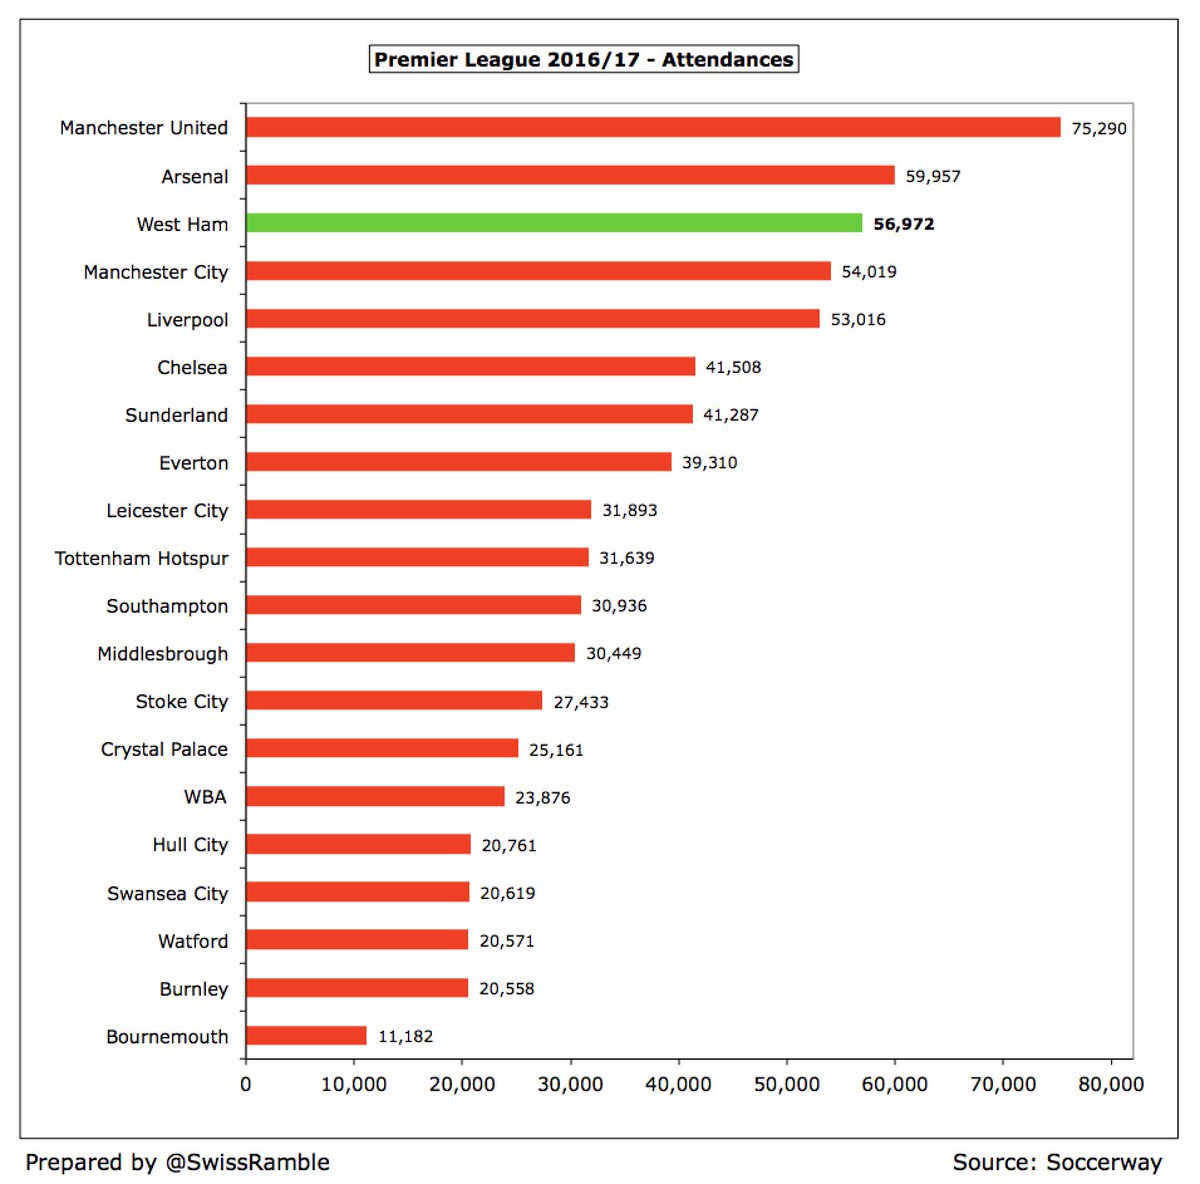
#WHUFC attendance of 56,972 was the third highest in the Premier League, only beaten by Manchester United and Arsenal, but it’s not a financial game changer. As chairman David Sullivan said in an interview, “We’re about £10m a year better off. It’s not going to change our lives.” 
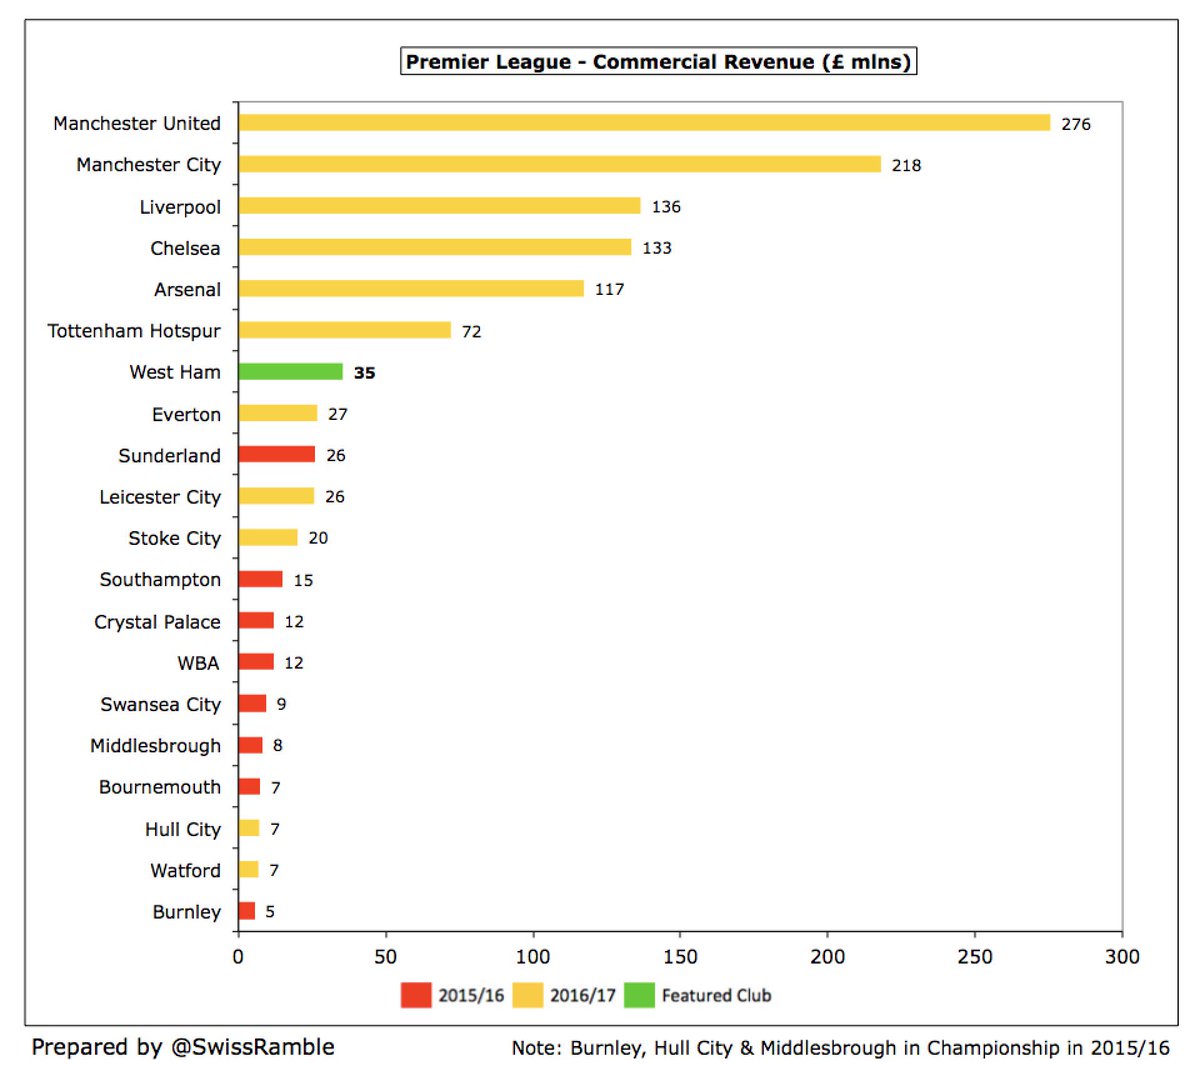
#WHUFC commercial income increased by £7.0m (25%) from £28.4m to £35.4m with hospitality areas sold out for next 3 years. Betway shirt sponsorship will rise £4m in 17/18, while stadium naming rights are still up for grabs after Vodafone pulled out (club gets 40% over £4m a year). 
The #WHUFC wage bill increased £10m (12%) from £85m to £95m in 2016/17, reducing the wages to turnover ratio from 60% to 52% following the revenue growth. Since the club was promoted to the Premier League, revenue has grown by £94m, while wages are up £39m. 
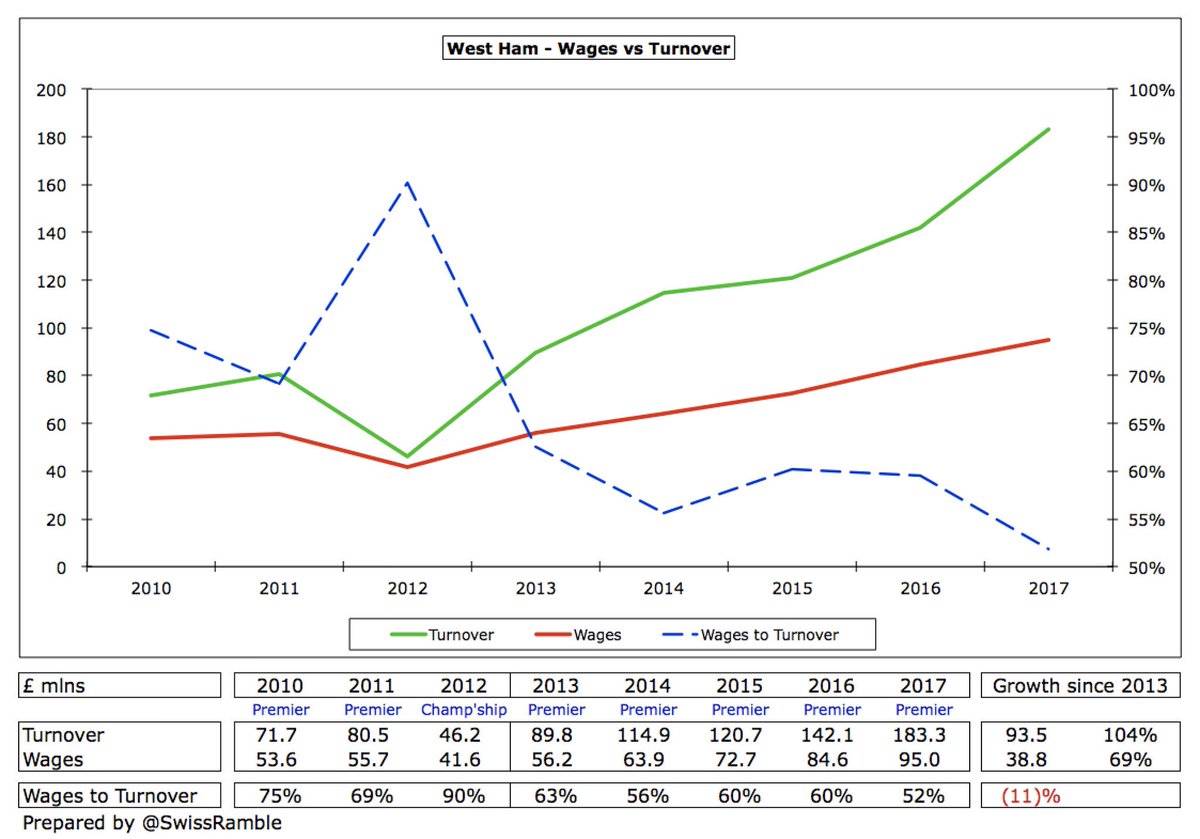
Despite the increase in the #WHUFC wage bill to £95m, this is still a fair bit lower than the top five clubs, e.g. less than half of #AFC £199m. Perhaps a better comparison is #EFC, whose wages are £10m higher than the Hammers. 

The #WHUC wages to turnover ratio of 52% is one of the lowest in the Premier League, only higher than three clubs, who all have much higher revenue, namely #MUFC 45%, #AFC 47% and #THFC 48% (2015/16). The club’s ability to increase wages is constrained by the PL’s FFP rules. 

#WHFC player amortisation surged 32% (£11m) from £34m to £45m, reflecting the club’s significant investment in the playing squad. This compares to a low of £10m in 2012. 
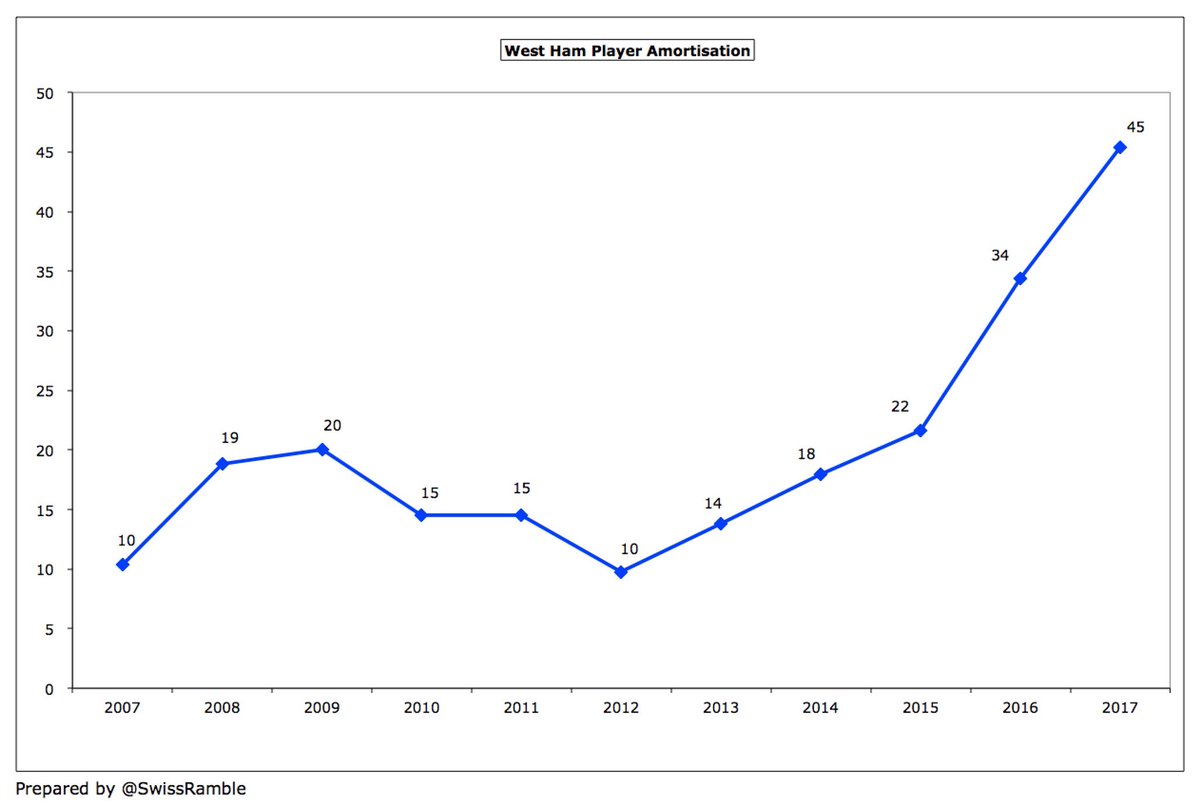
Despite the growth, #WHUFC player amortisation of £45m is still only around a third of big-spending #MUFC £124m and #MCFC £122m, though it will again rise in 2017/18 after this season’s purchases (£56m to date). 

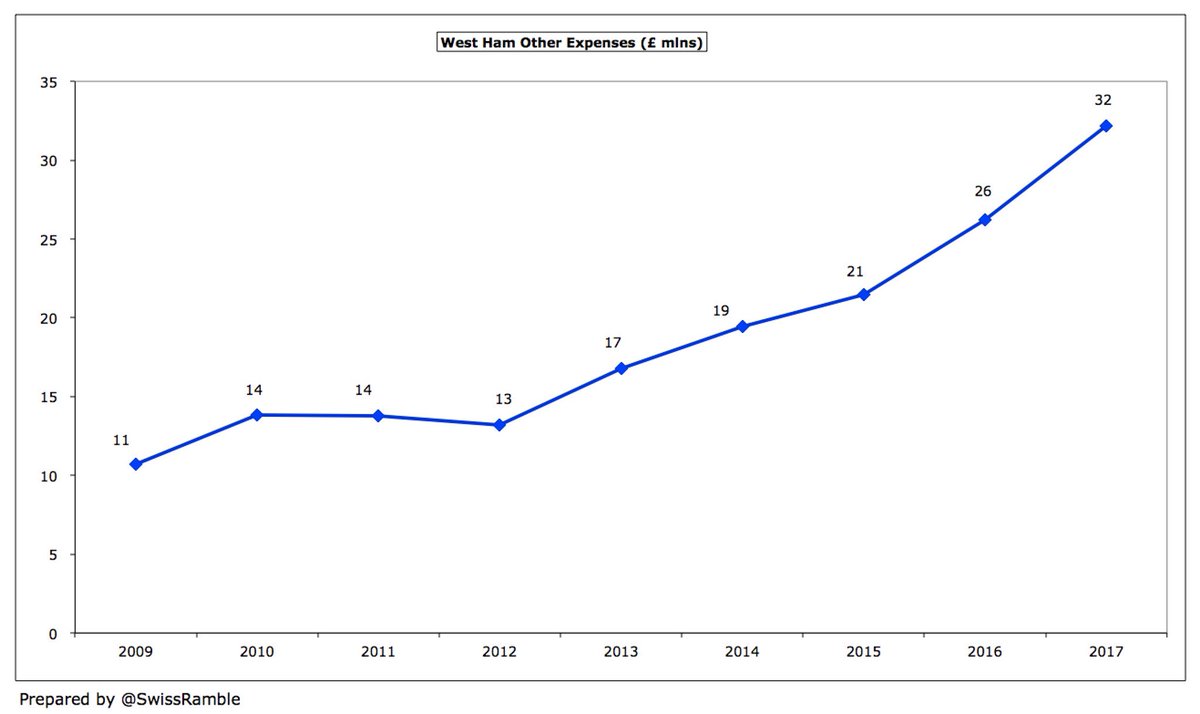
Although wages represent the largest cost, it’s worth keeping an eye on #WHUFC other expenses, which were up 23% (£6m) to £32m in 2016/17, including an increase in stadium lease payments. This cost category has tripled from £11m in 2009. 
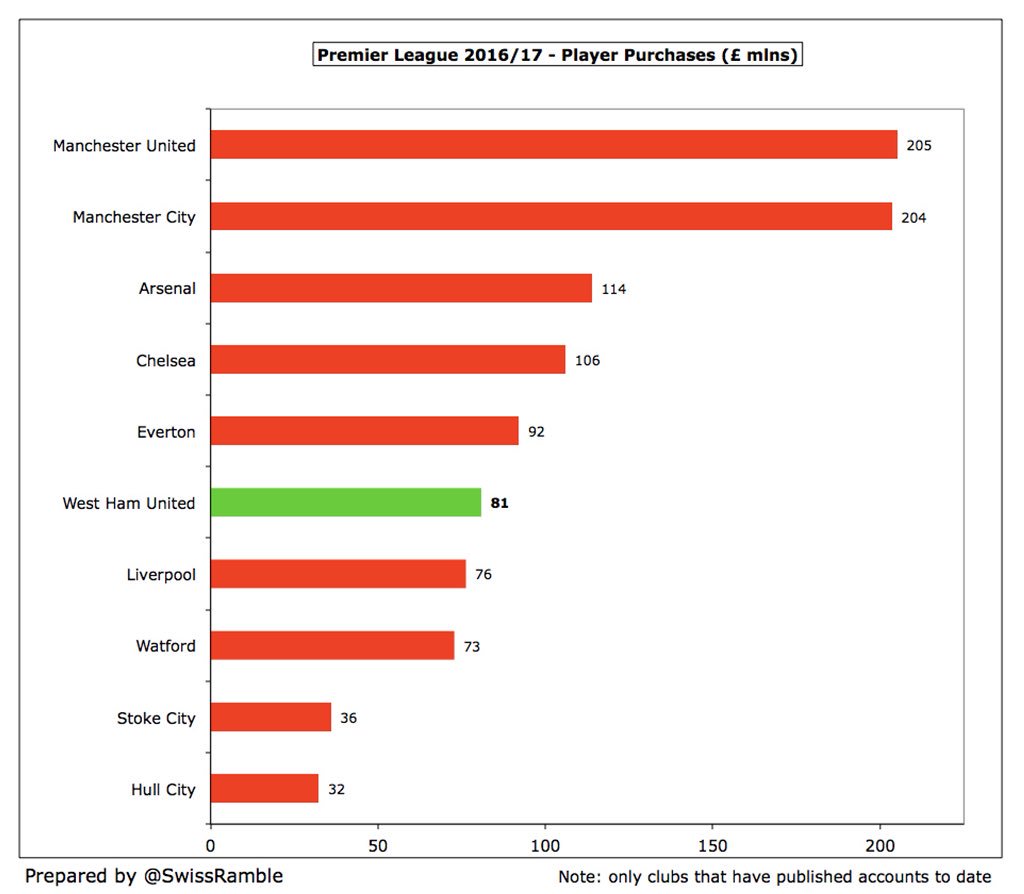
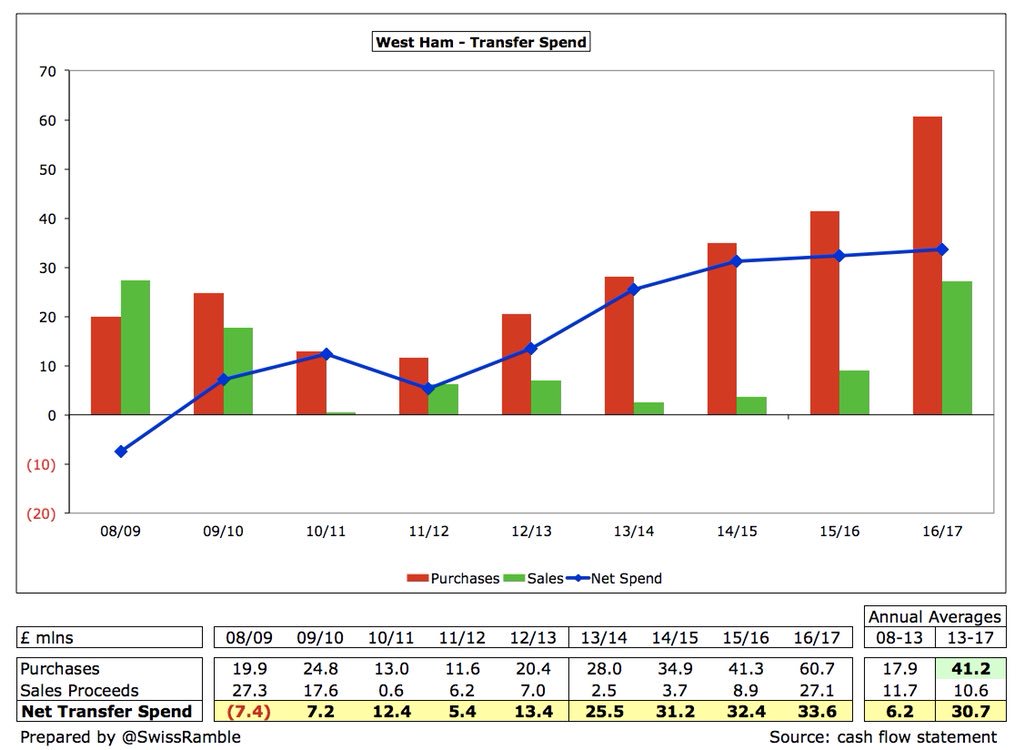
As a sign of their “significant investment”, #WHUFC made player purchases of £81m in 2016/17 (Ayew, Snodgrass, Lanzini, Fonte, Masuaku, Fernandes). That makes £134m in last two seasons, around twice as much as previous two years. However, they were still outspent by Everton £92m. 
#WHUFC have really ramped up their transfer spending with annual net spend (on a cash basis) averaging £31m in last 4 years compared to £6m in previous 5 years. This season shows more of the same with £23m net, including big money purchases of Arnautovic and Chicharito. 
#WHUFC net debt fell by £21m; gross debt cut by £19m to £76m, while cash rose by £2m to £30m. Gross debt comprises £45m from the owners (interest reduced to 4% from 6-7%) + £30m short-term loan with Rights & Media Funding Ltd. £15m legacy bank debt was repaid during the season. 
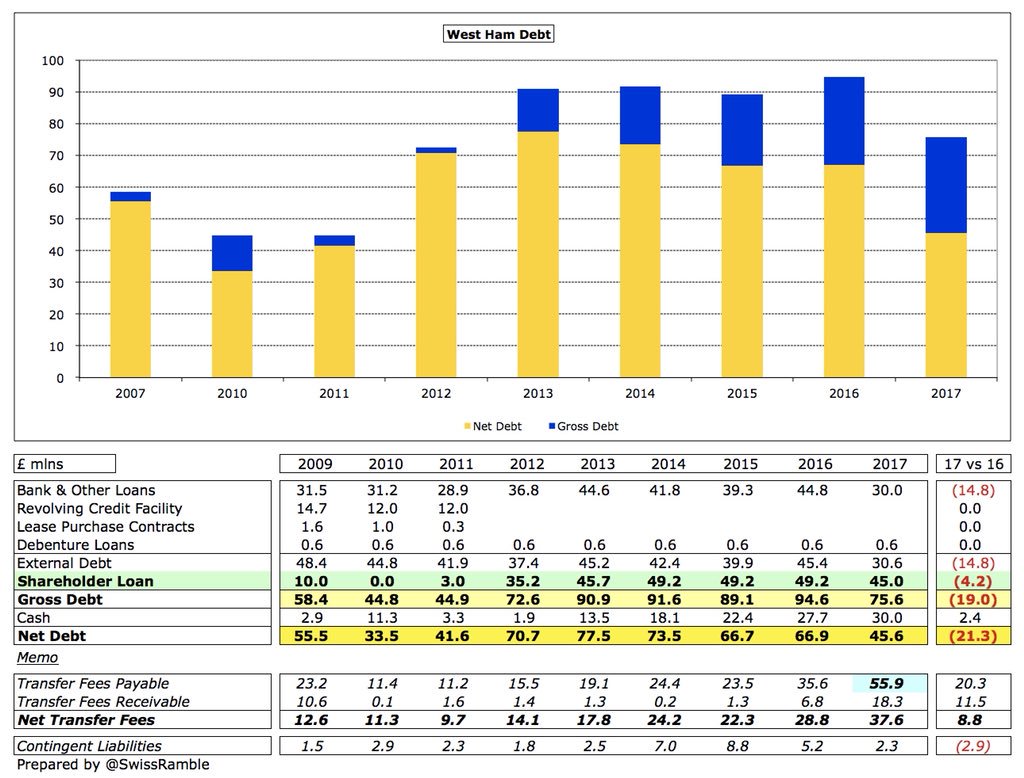
#WHUFC also repaid £4.2m (+ £2.2m accrued interest) to owners. After accounts closed they paid them £10m as partial settlement of accrued interest. The Rights £30m loan was repaid in July, but replaced by £25m loan. New director J Albert Smith provided a £9.5m interest-free loan.
#WHUFC gross debt of £76m is nowhere near the largest in the Premier League. Most notably #MUFC still have £503m even after all the Glazers’ re-financings and #AFC £227m for the “mortgage” on the Emirates stadium. 

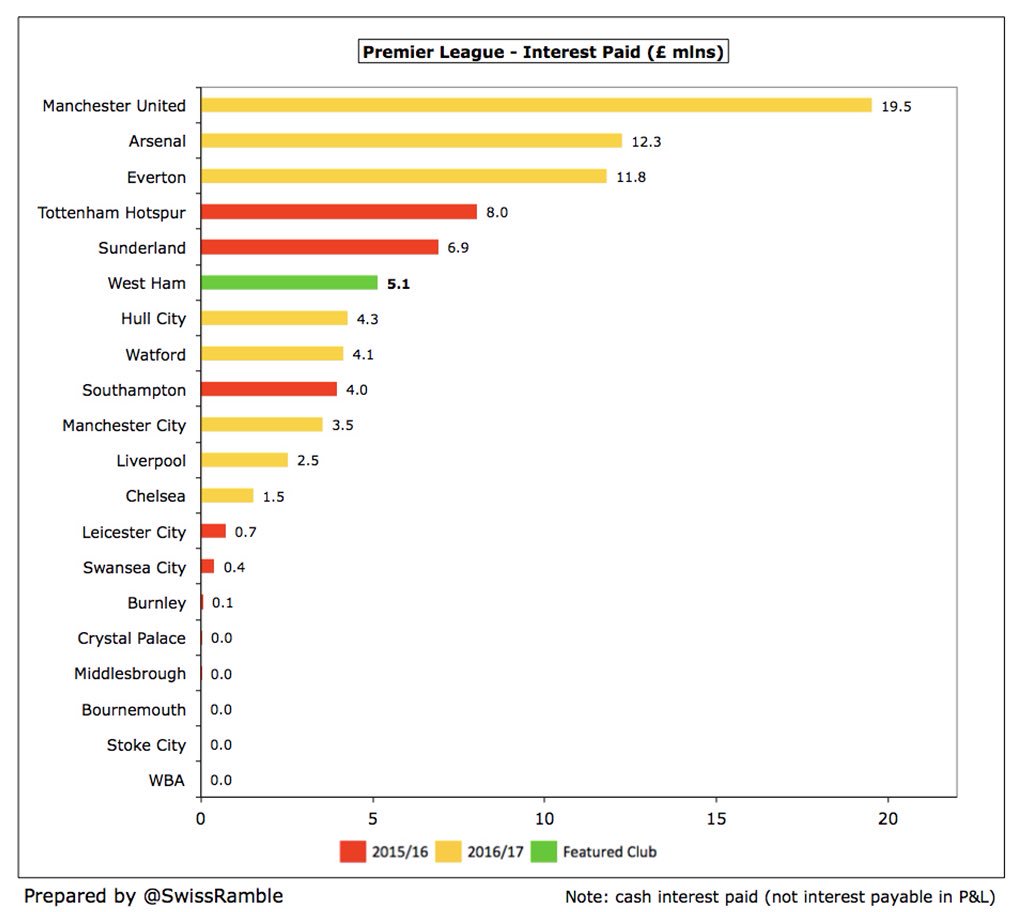
However, #WHUFC paid £5m of interest in 2016/17, which is at the higher end of the Premier League. Although Sullivan and Gold might love the club, they are not averse to charging them interest on their loans (unlike some more altruistic owners). 
#WHUFC improved finances are reflected in the cash flow statement. 2016/17 cash from operations was a healthy £39m, enhanced by proceeds from the Boleyn Ground sale. This was primarily used to purchase players (£34m) and repay loans (£19m), though £8m went on stadium fit-out. 
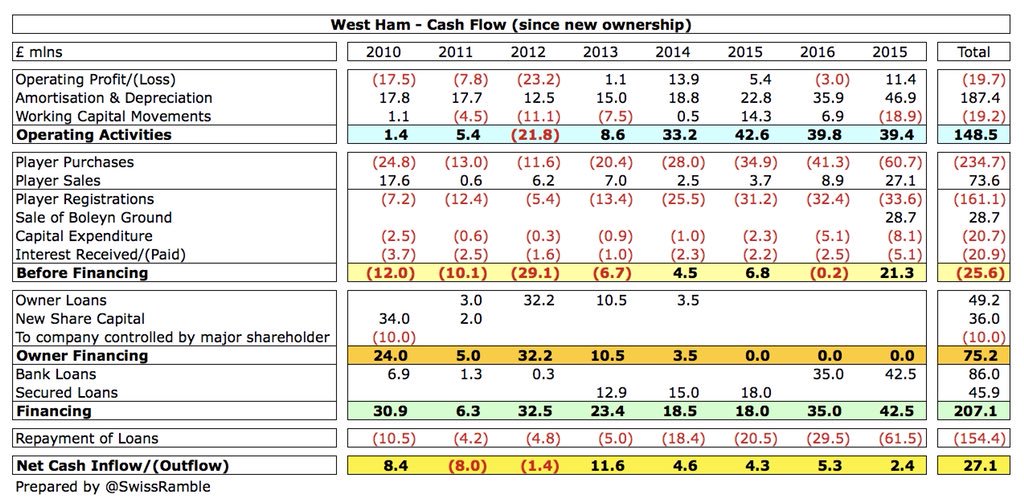
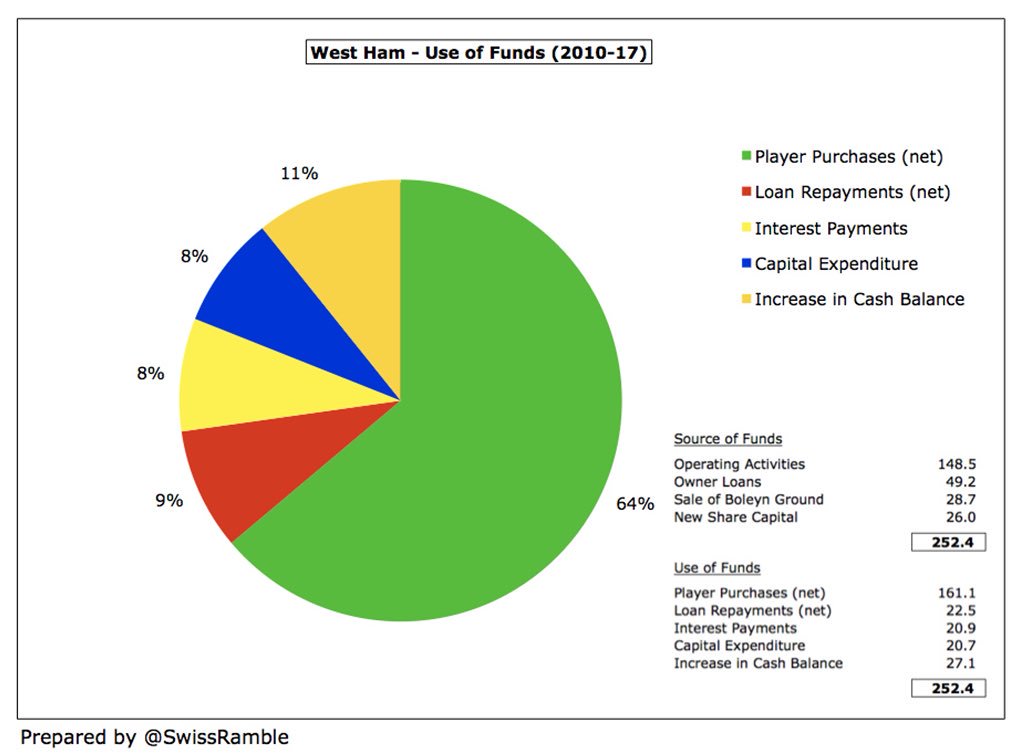
Since Sullivan and Gold arrived, majority of cash has come from club’s own operations £148m, supplemented by £75m financing from the owners (£49m loans & £26m share capital). Around two-thirds (£161m) was spent on new players, £43m on loan/interest payments and £21m on capex. 
In summary, David Sullivan was right when he said, “the club is in the healthiest financial position it has been in for years.” The question that #WHUFC fans will ask is whether the owners have made the best use of these riches.
• • •
Missing some Tweet in this thread? You can try to
force a refresh


