J. Miles Coleman Profile picture
Apr 13, 2018 11 tweets 8 min read Twitter logo Read on Twitter
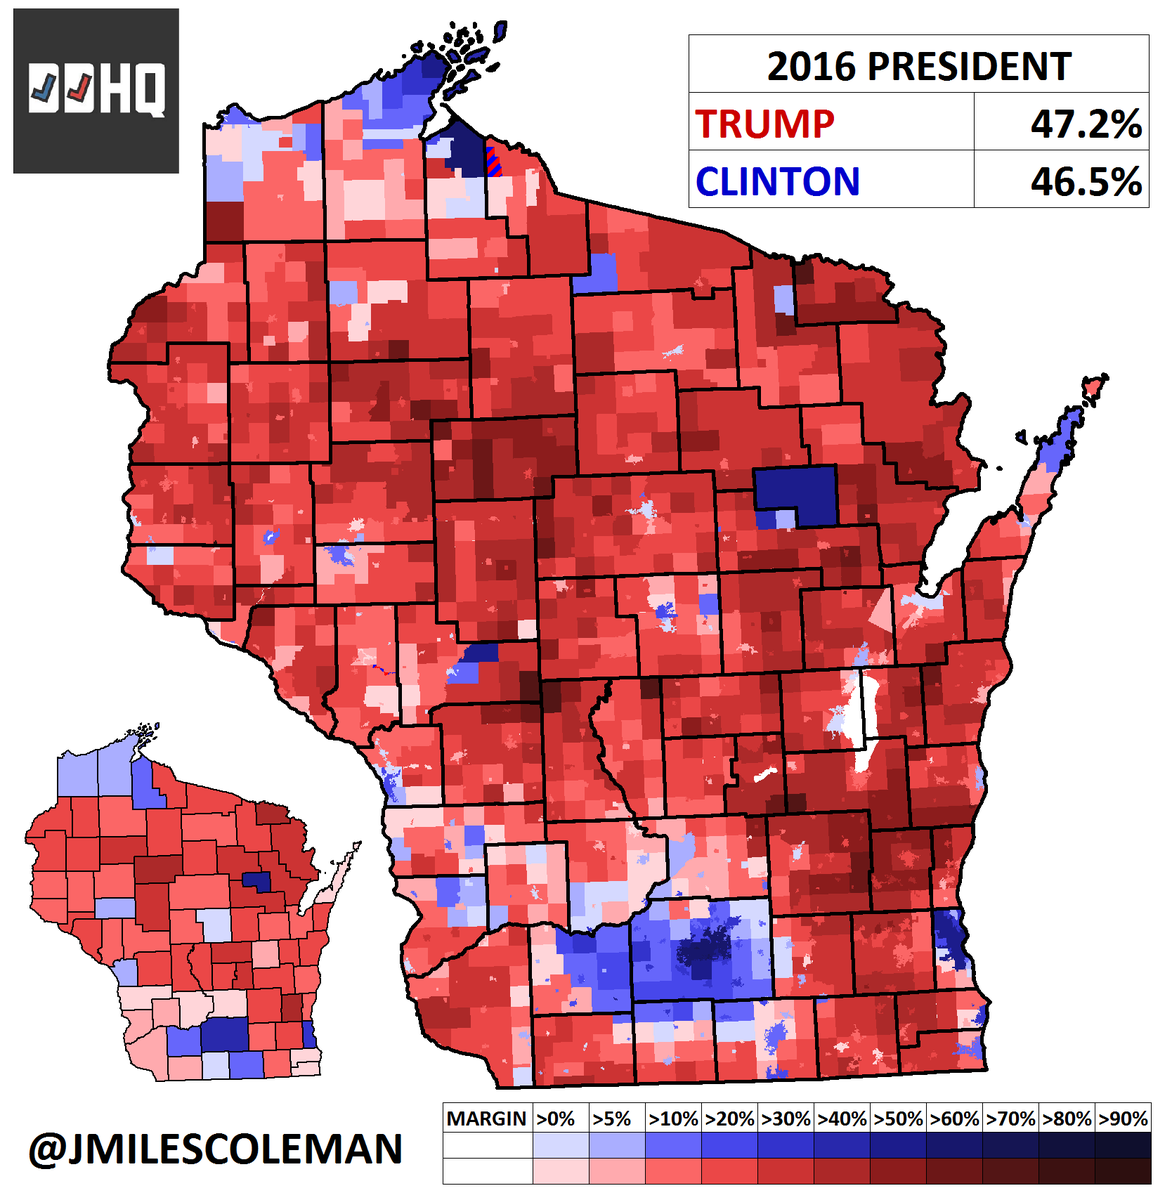
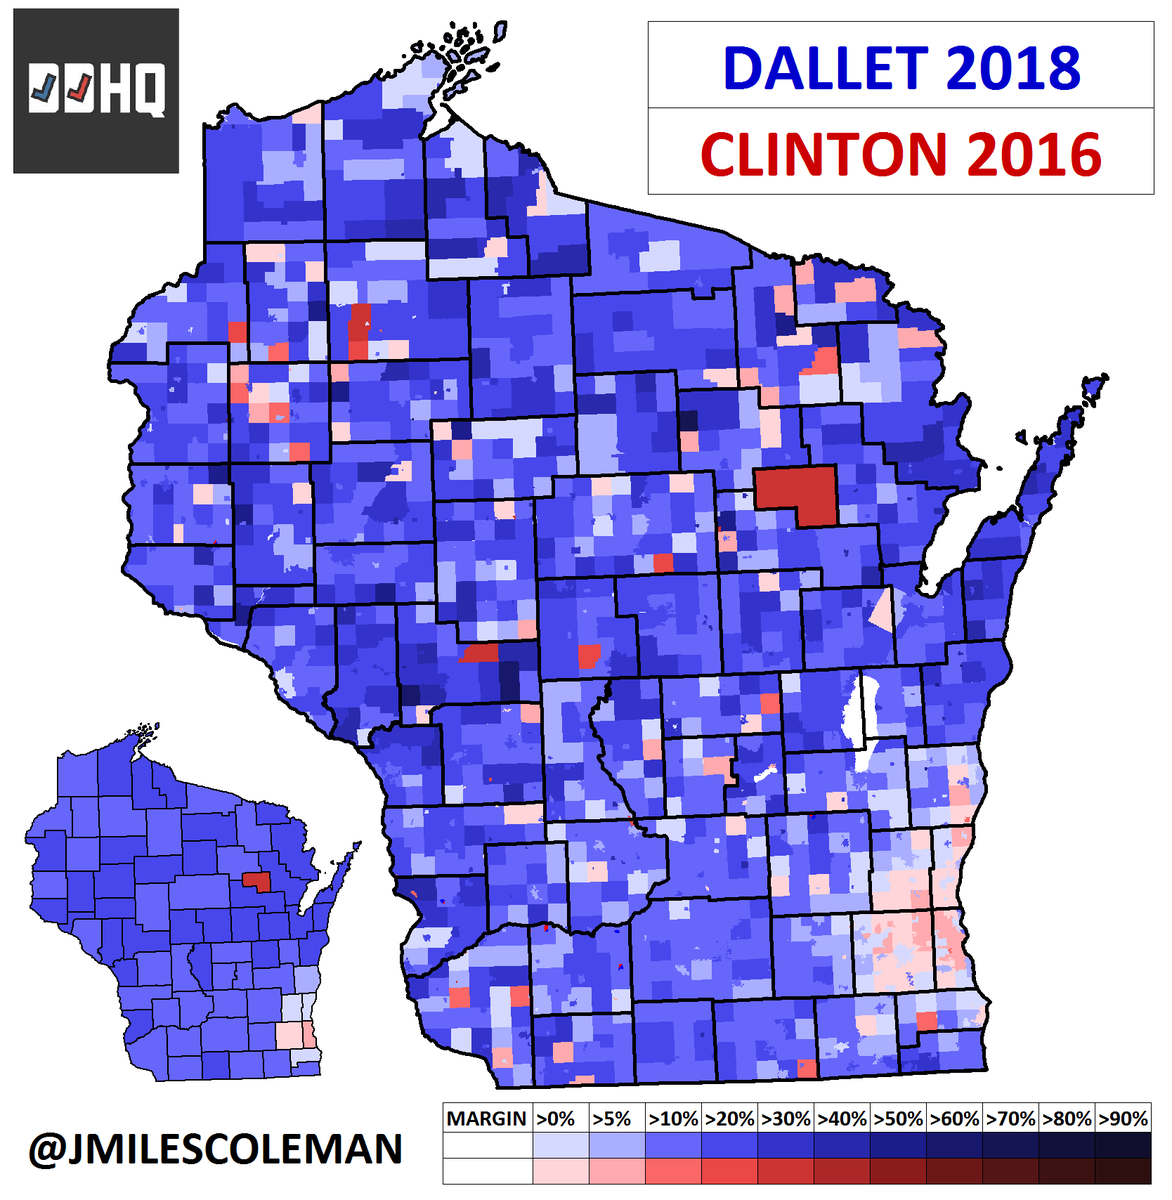
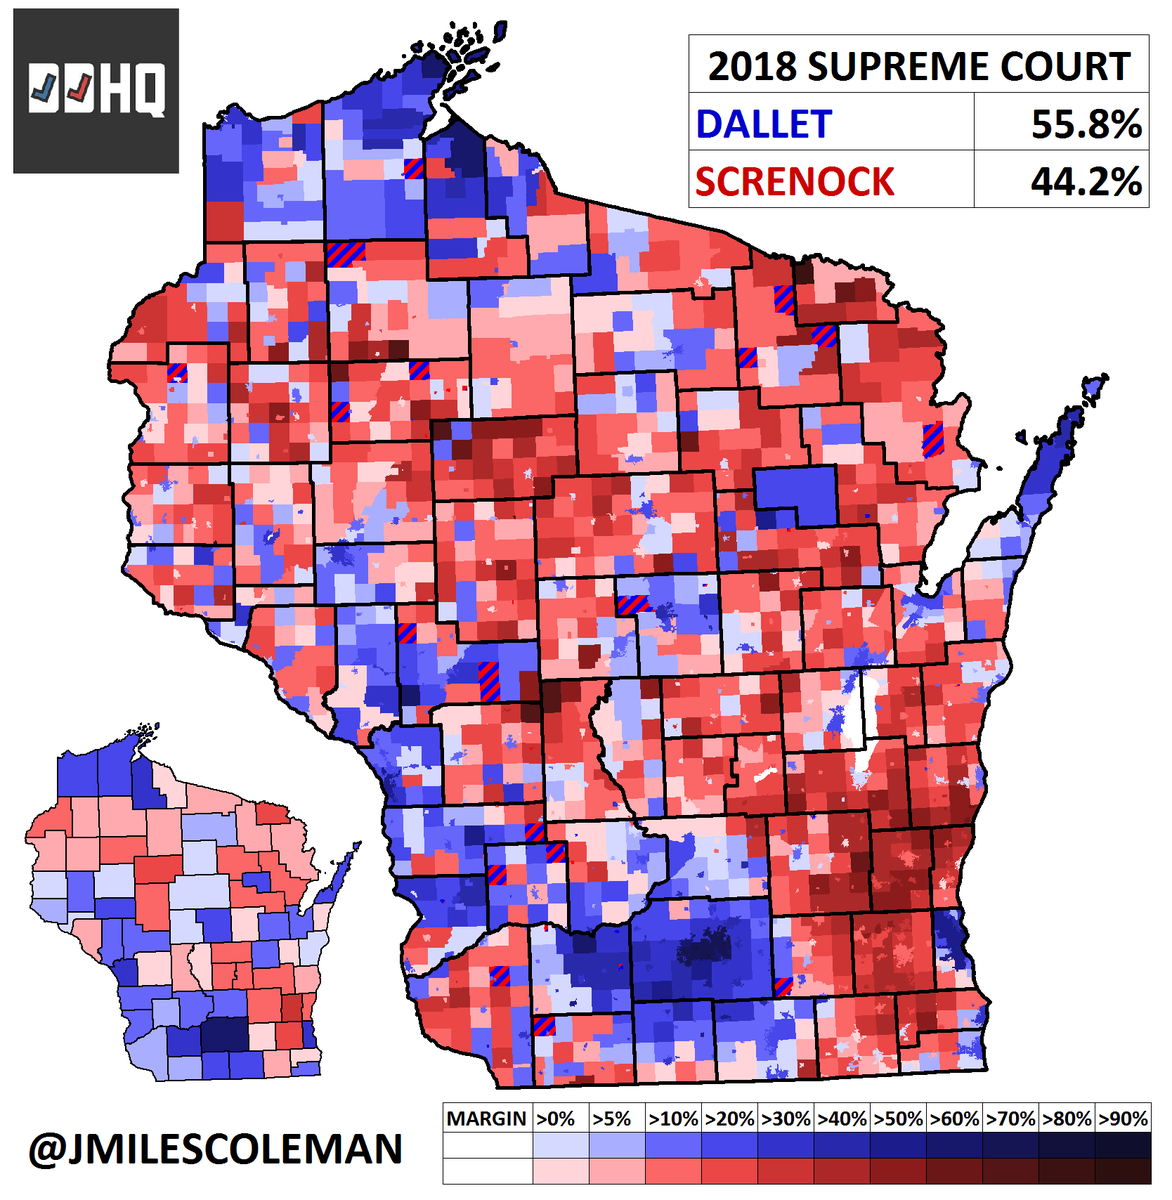
Ok guys, tonight we'll be doing a thread on last week's Wisconsin Supreme Court race. Democratic-aligned Rebecca Dallet beat GOP-supported Michael Screnock by almost 12%.
#SCOWIS #wopolitics #ElectionTwitter
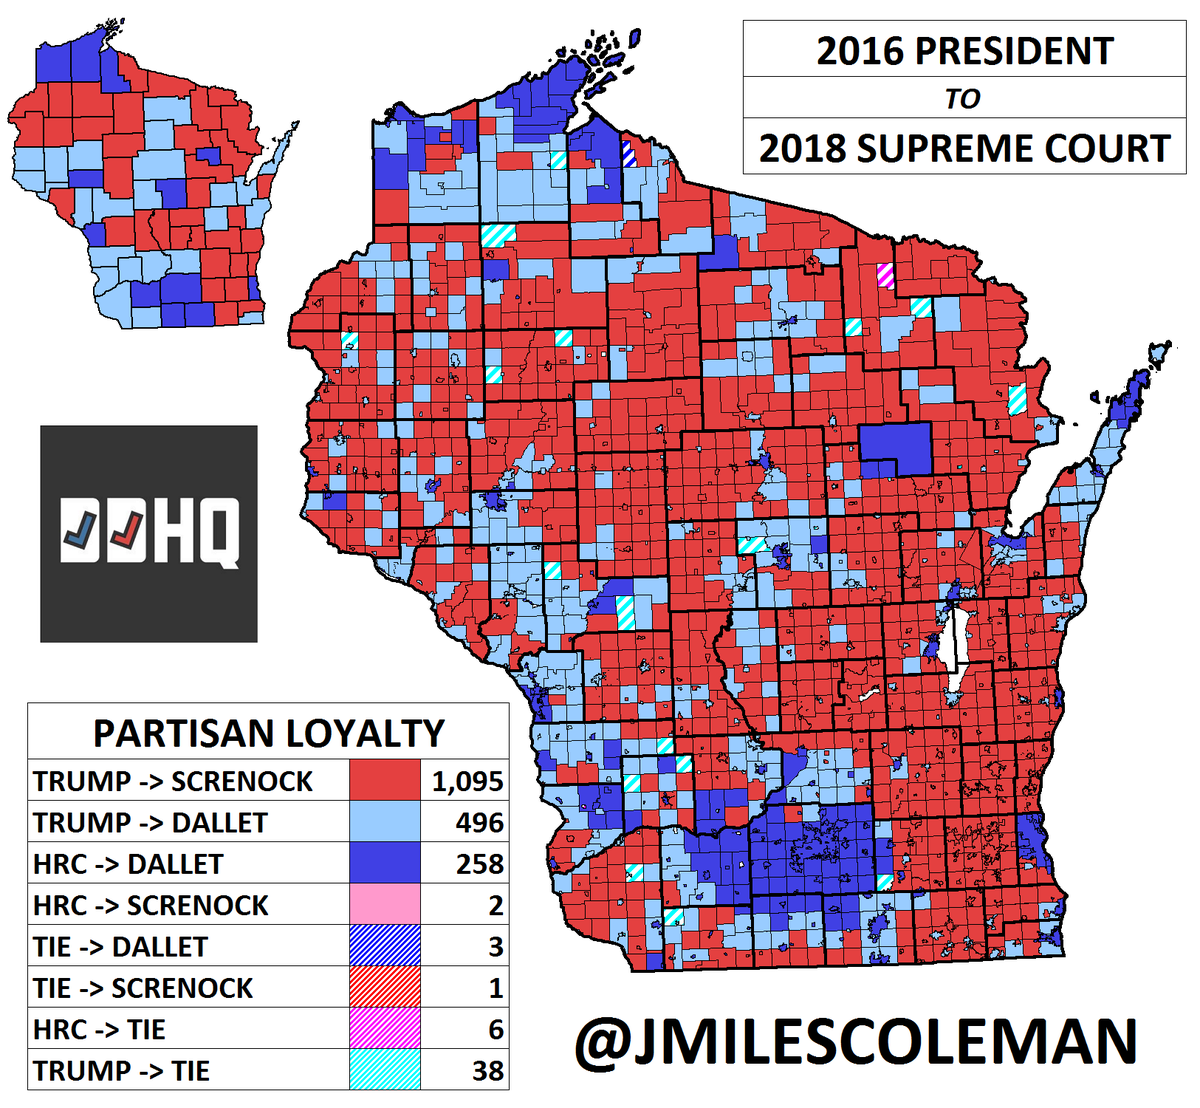
Compared to Clinton, who narrowly lost, Dallet had a lot of upside. She performed better in 69 of 72 counties. Further, looking at partisan loyalty, nearly 2/3 of her municipalities (496 of 757) voted for Trump. She flipped 24 counties. Only 2 HRC towns went to Screnock.
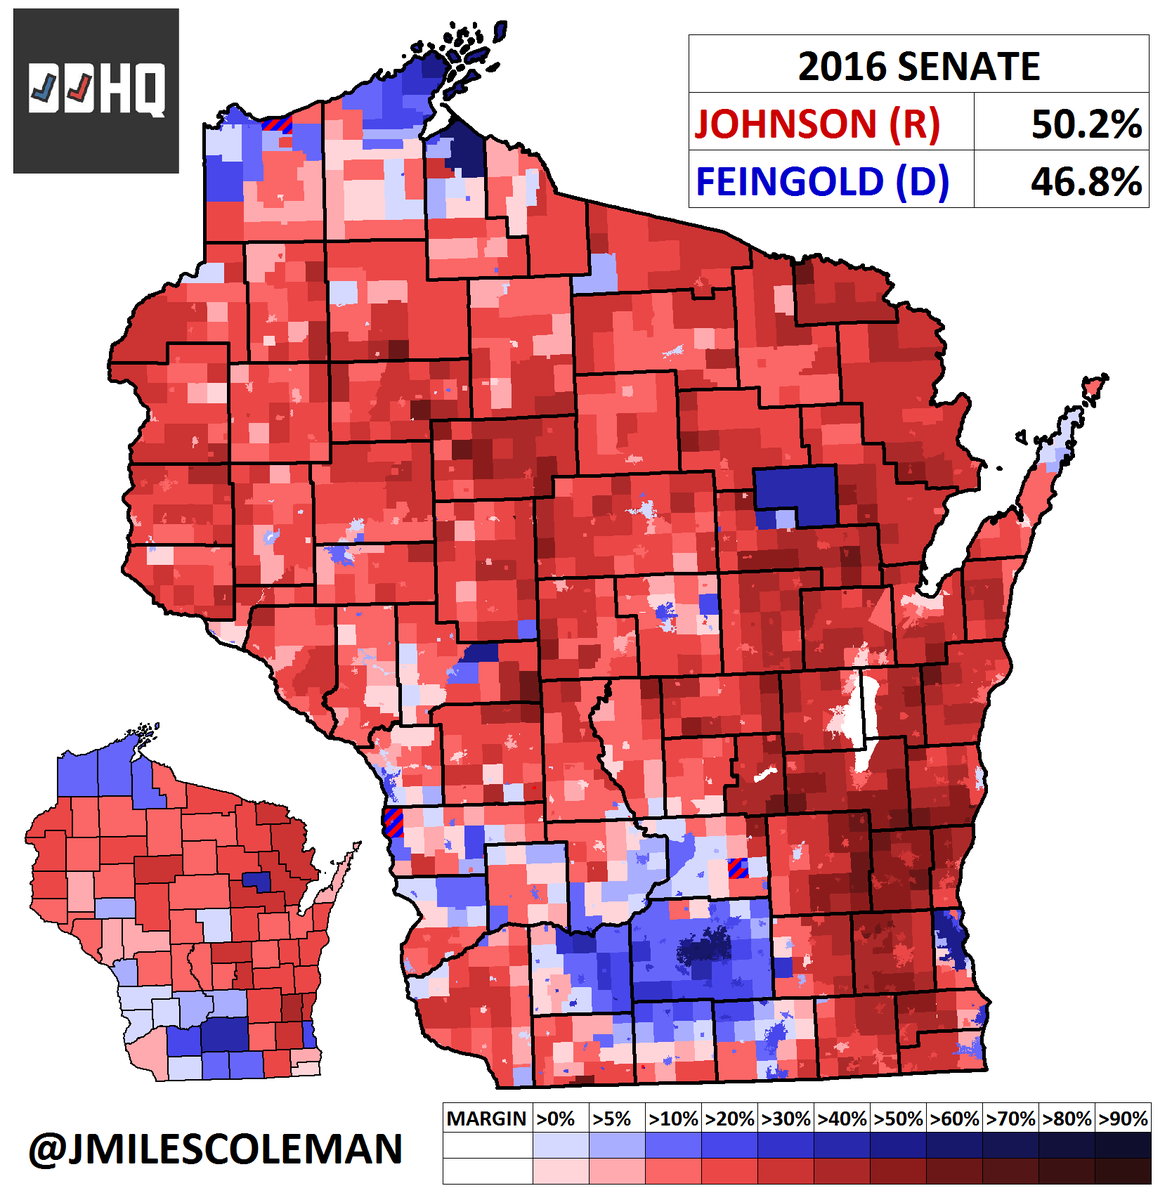
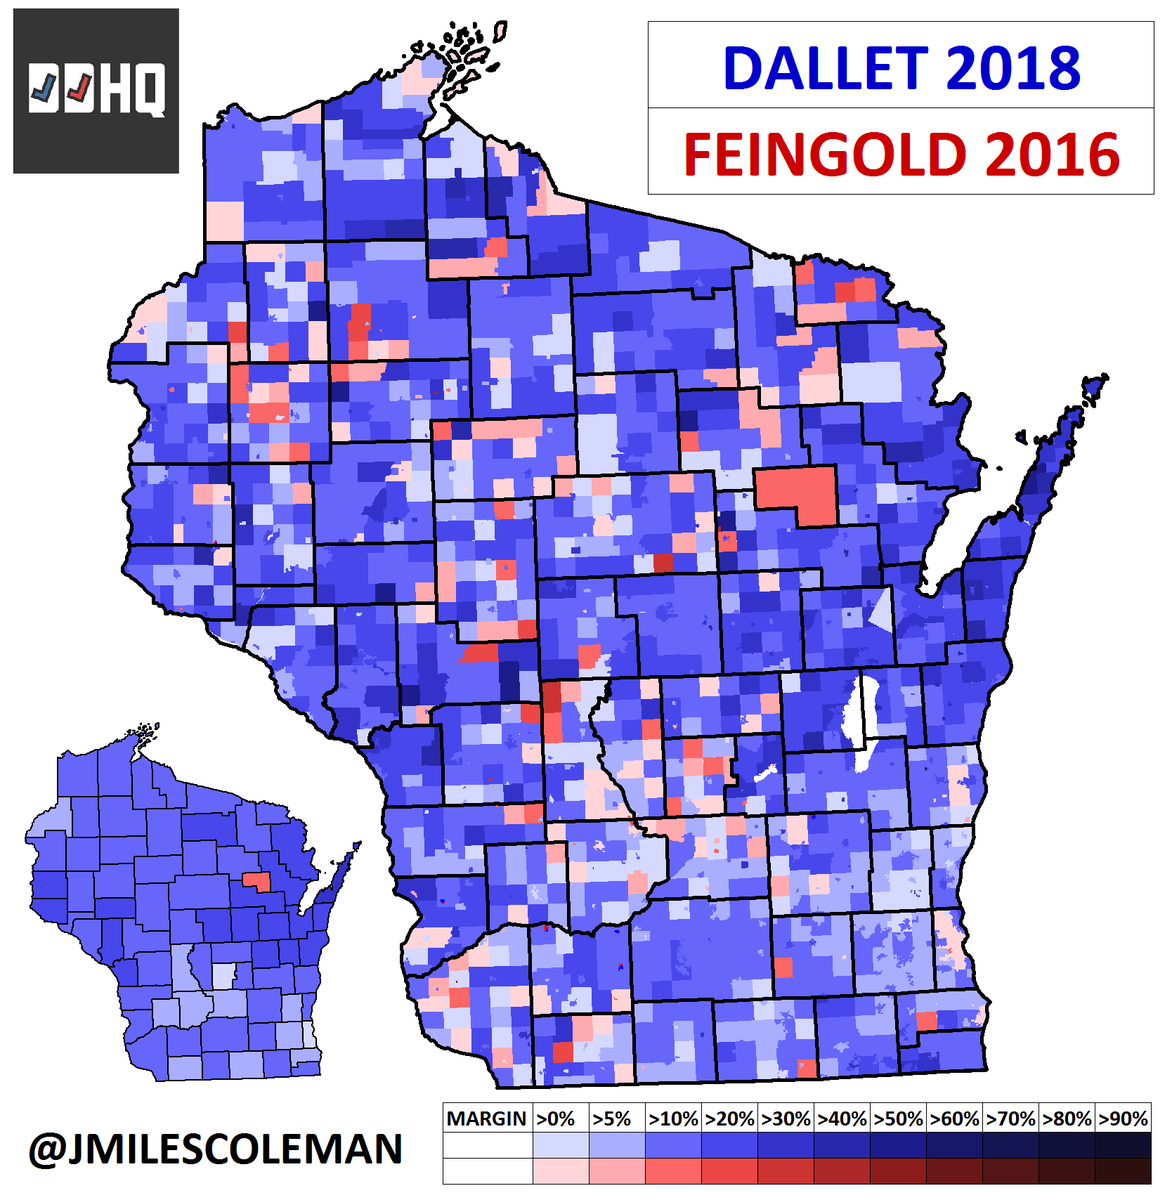
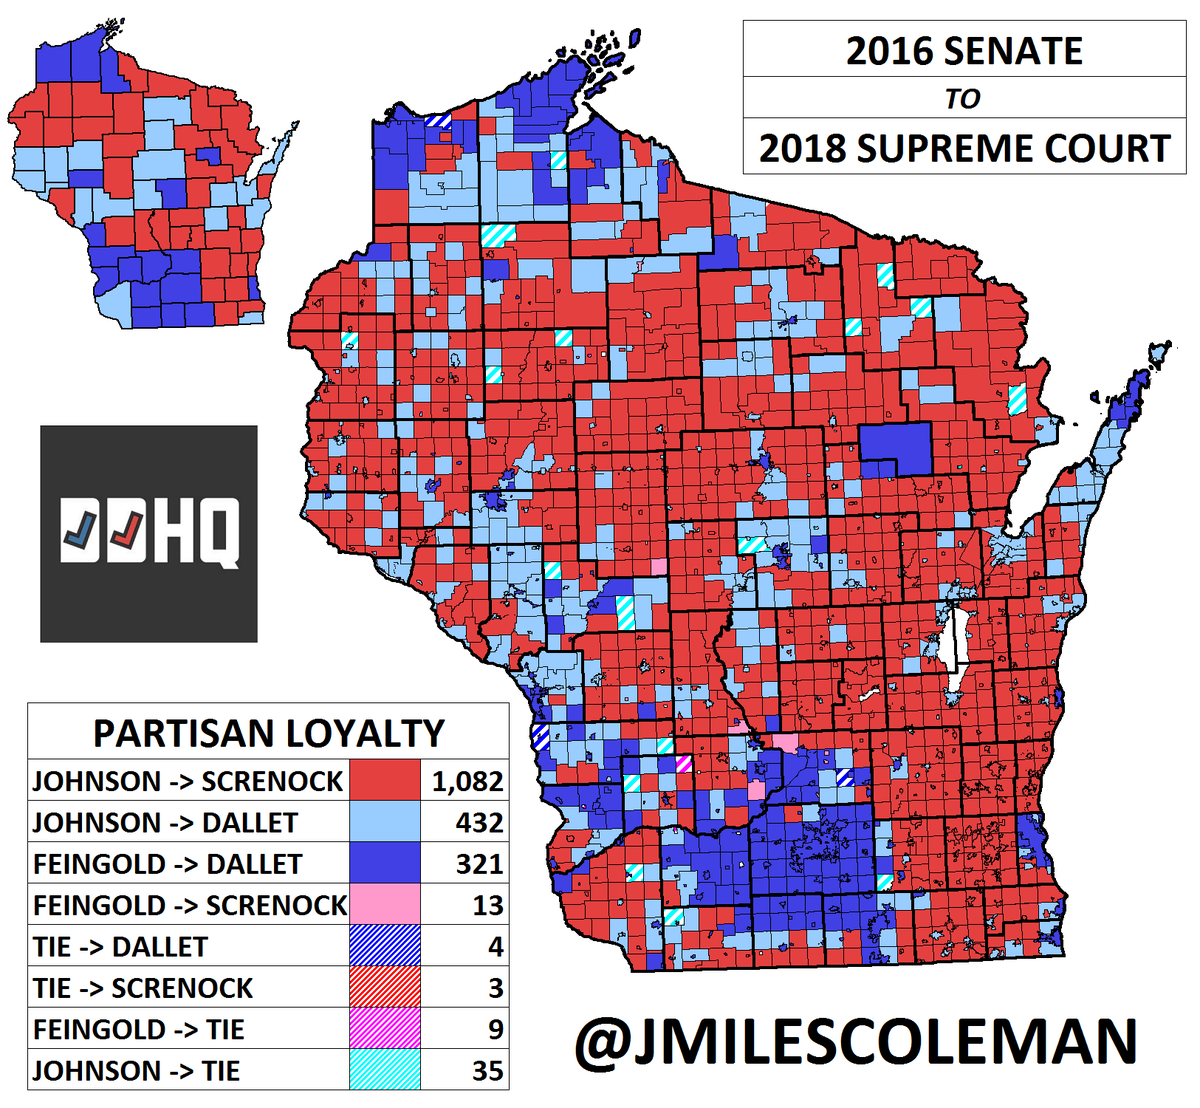
In the 2016 #WISen race, Sen. Ron Johnson (R) won a rematch w/ex-Sen. Russ Feingold (D). Feingold ran under HRC overall, but better in rural areas. As a result, there were fewer Johnson municipalities for Dallet to flip. She still flipped 432, as well as 18 counties.
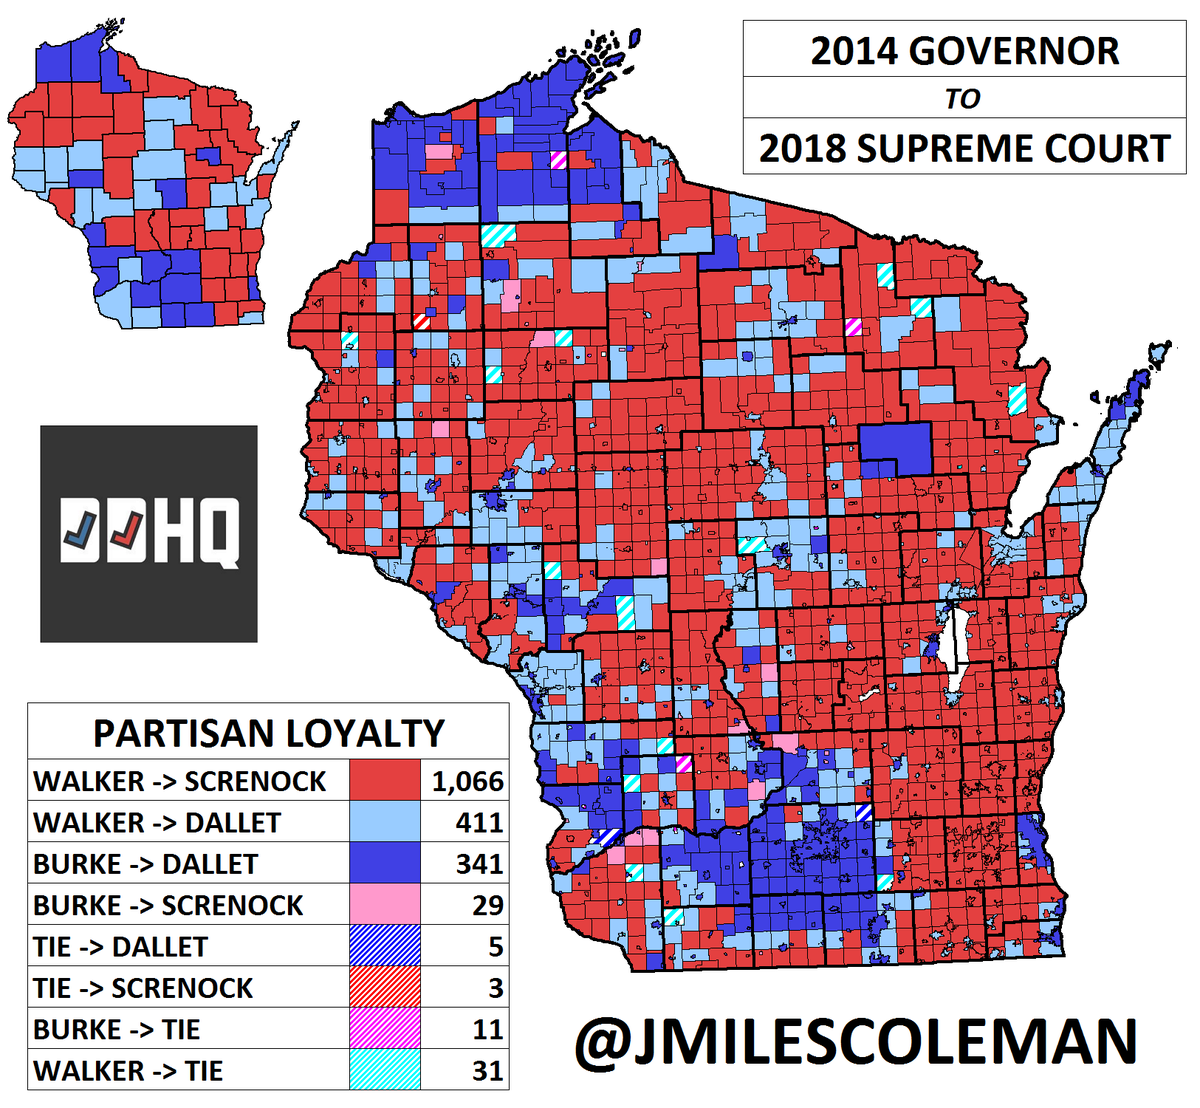
"But Miles, what about Scott Walker? Isn't he up this year? How'd this result compare to his #WIGov races?"
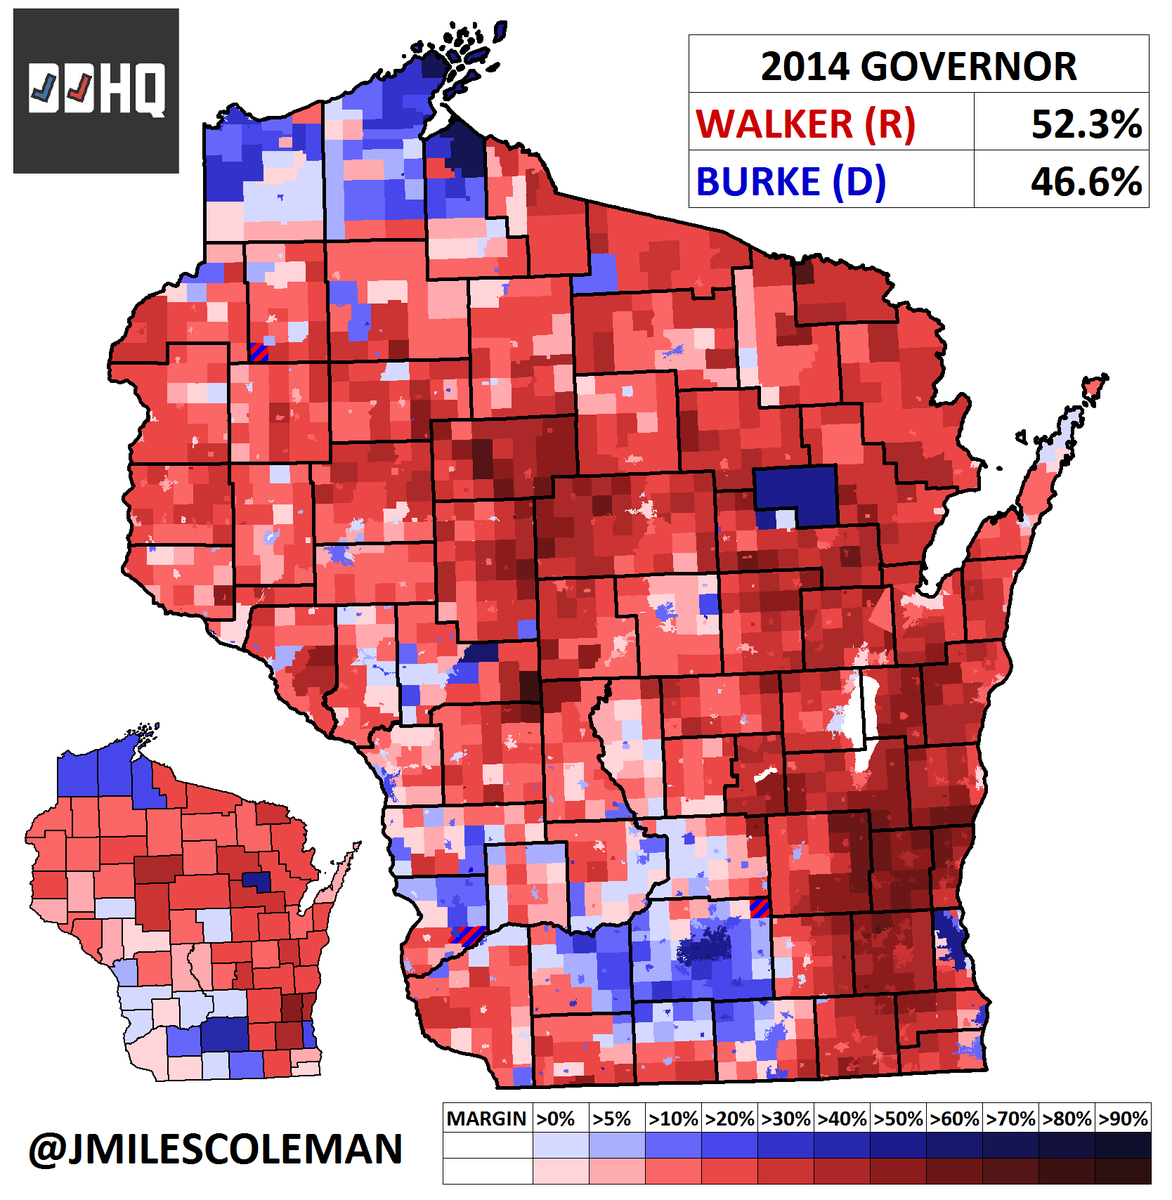
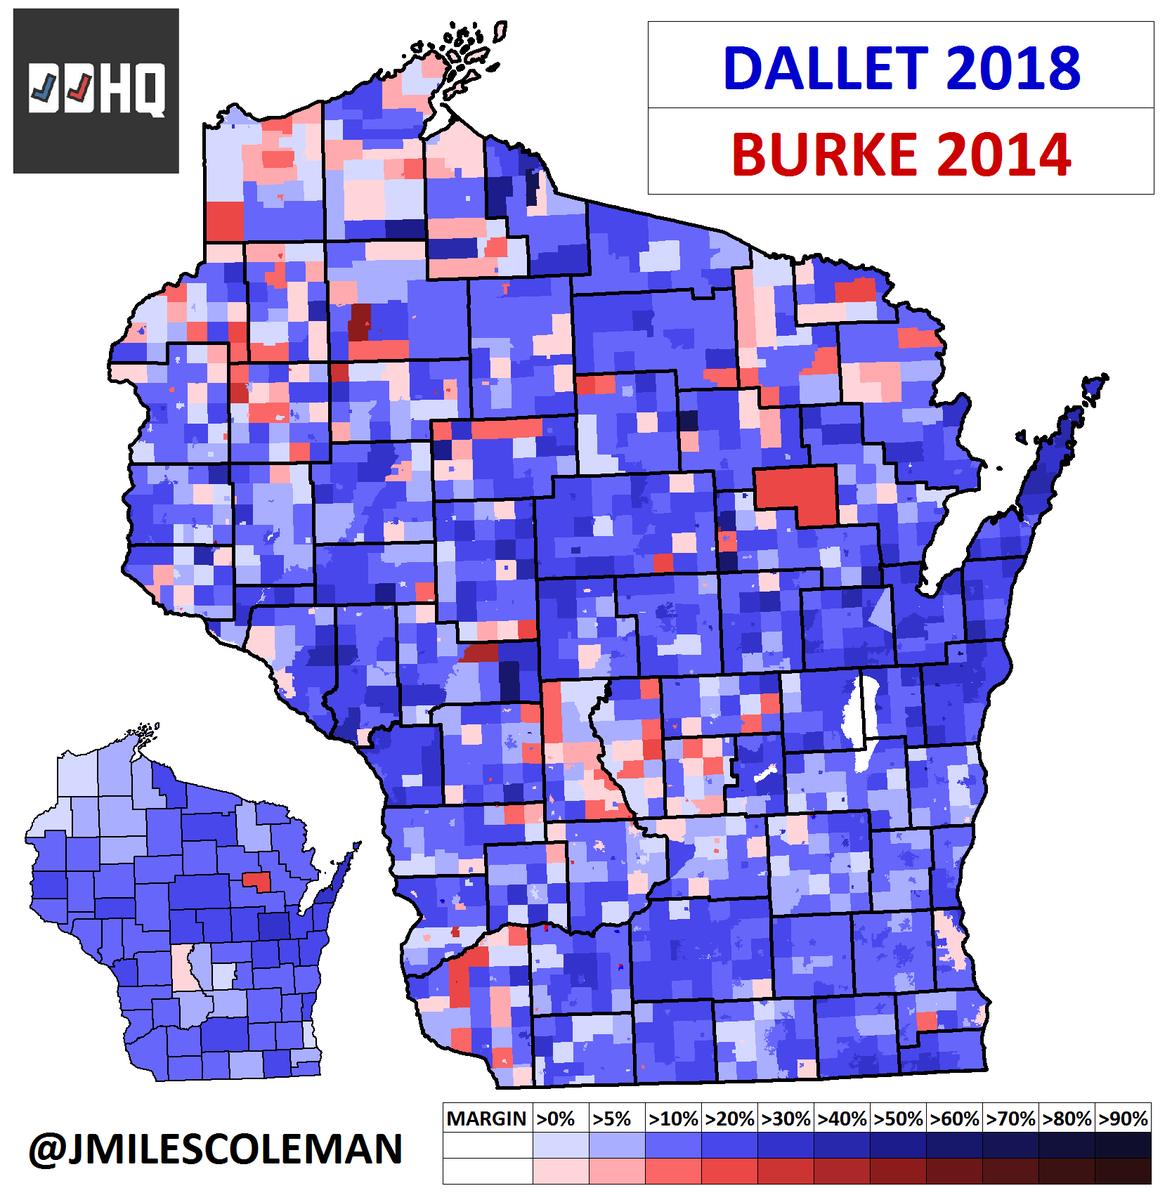
In 2014, Walker won #WIGov by 6% against Mary Burke. Dallet held 341 towns that voted Burke, plus added 411 Walker municipalities. She only lost 29 Burke municipalities. Juneau how many counties Dallet improved over Burke in? All but two - Menominee and... Juneau.
"But Miles, all these maps are nice, but what does Dallet's result look like compared to other *Democrats* who won in WI? These are all R wins..."
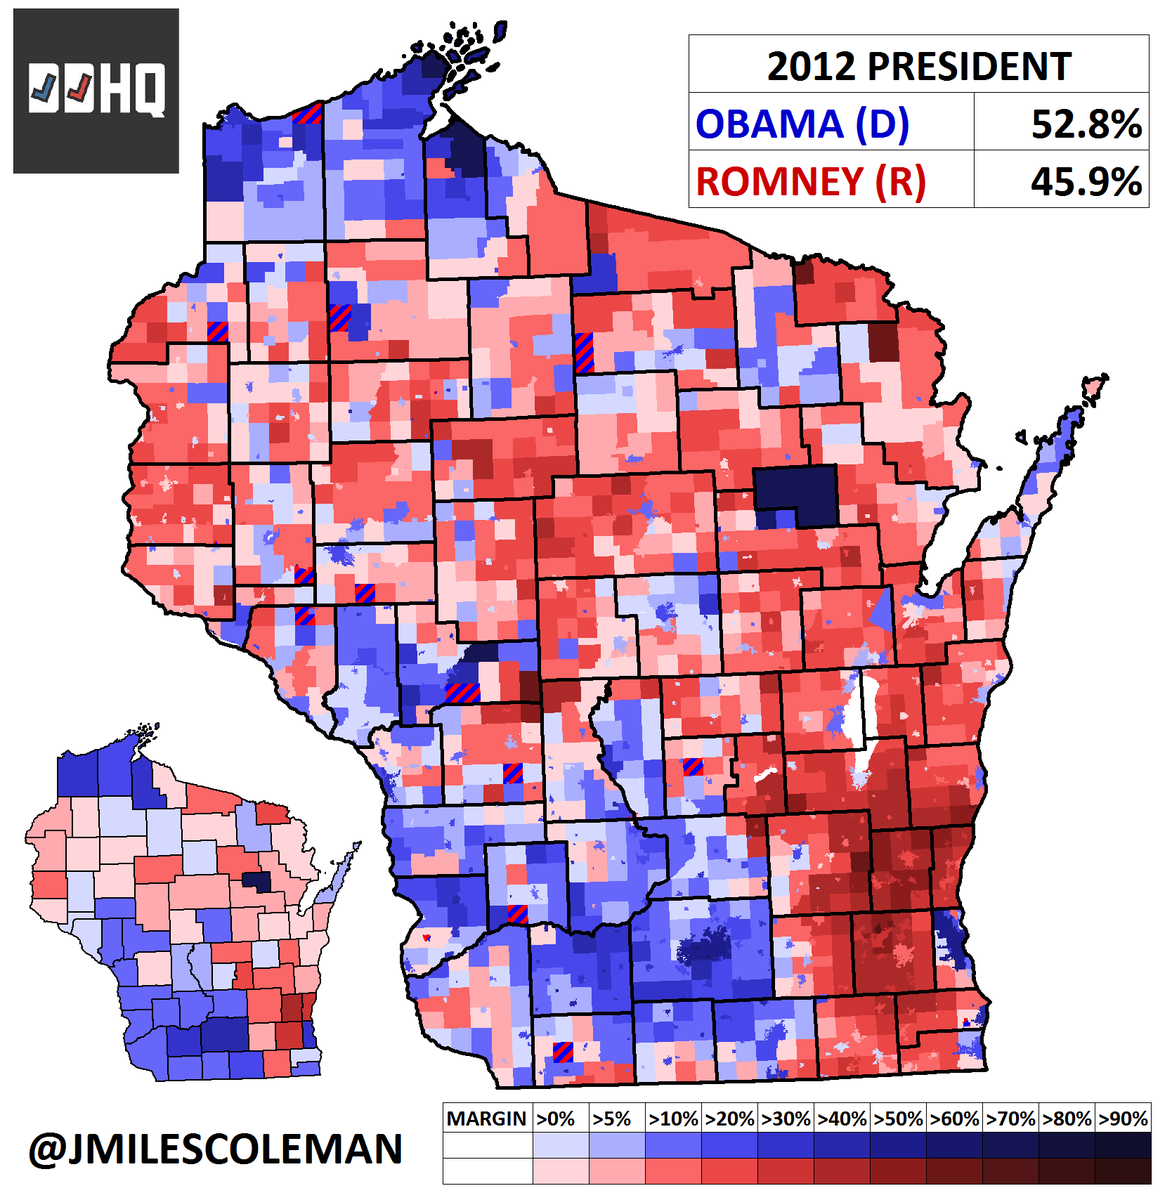
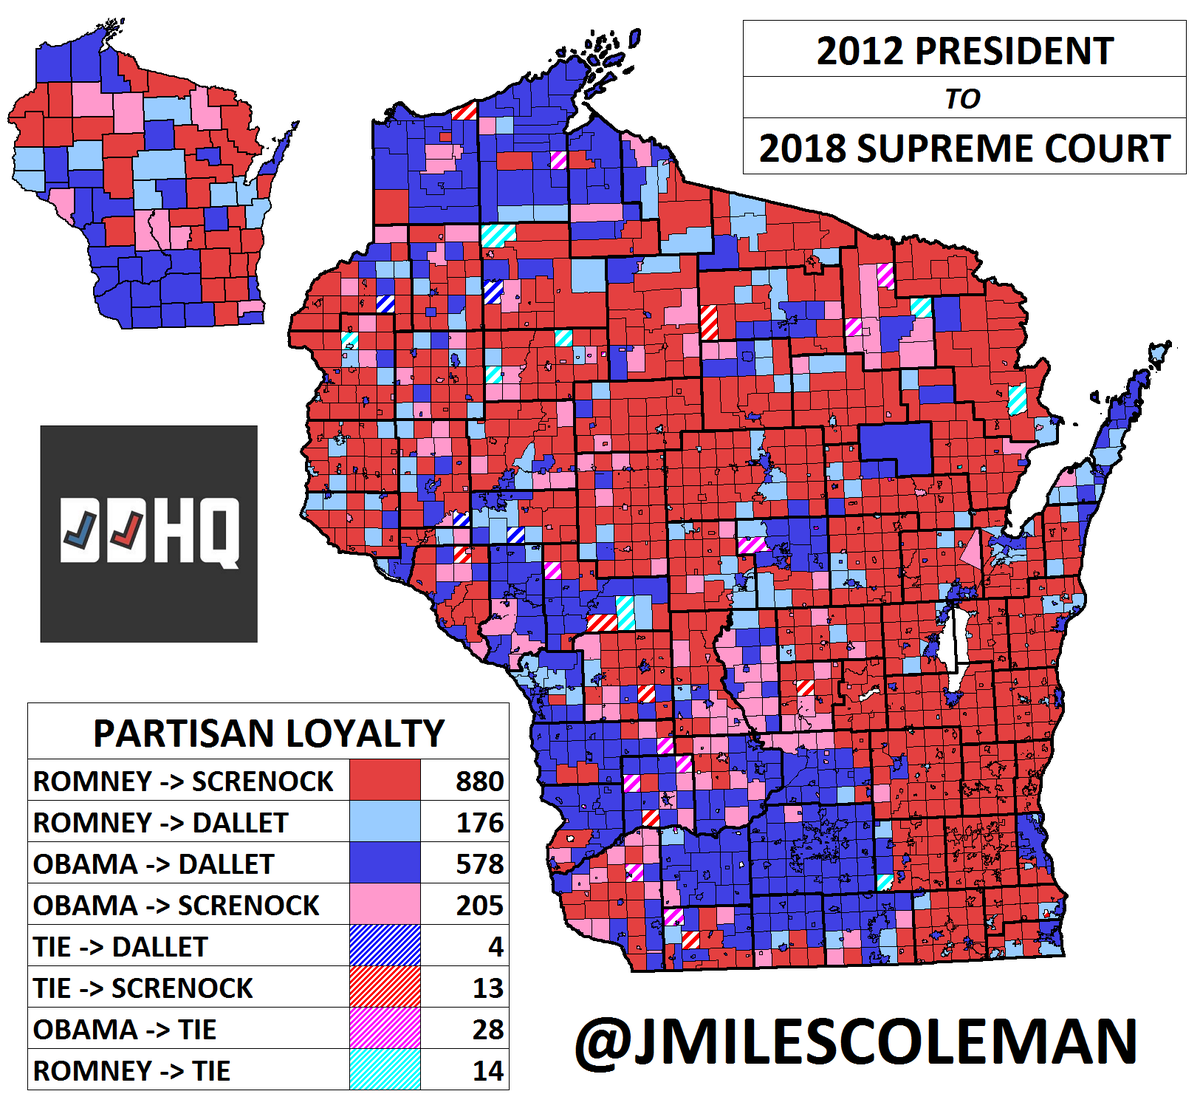
Lets consider 2012. Obama beat Romney by 7% in WI. While Dallet won by more, and did better in certain areas, the loyalty map is more interesting. There were actually more Obama -> Screnok towns (205) than Romney -> Dallet ones (176).
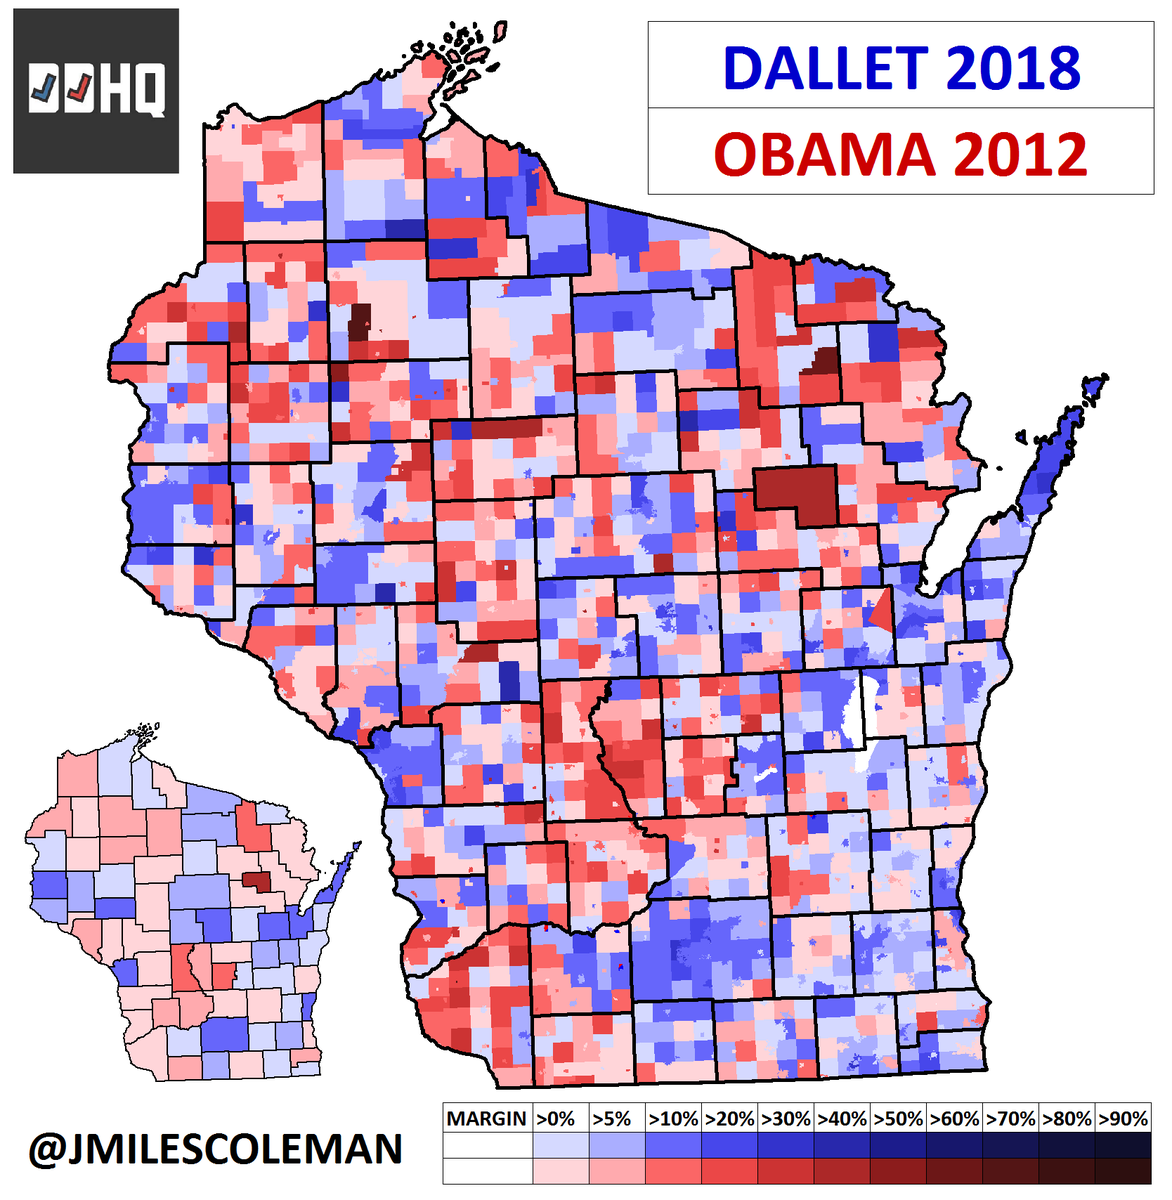
In that third map, note Dallet's strength in the northern Fox Valley (roughly from Green Bay into Appleton/Oshkosh). By contrast, Obama did better than Dallet in much of the rural north/west. Price County, for example, went to Obama by 3 *votes* in 2012. Dallet lost it by 5.5%.
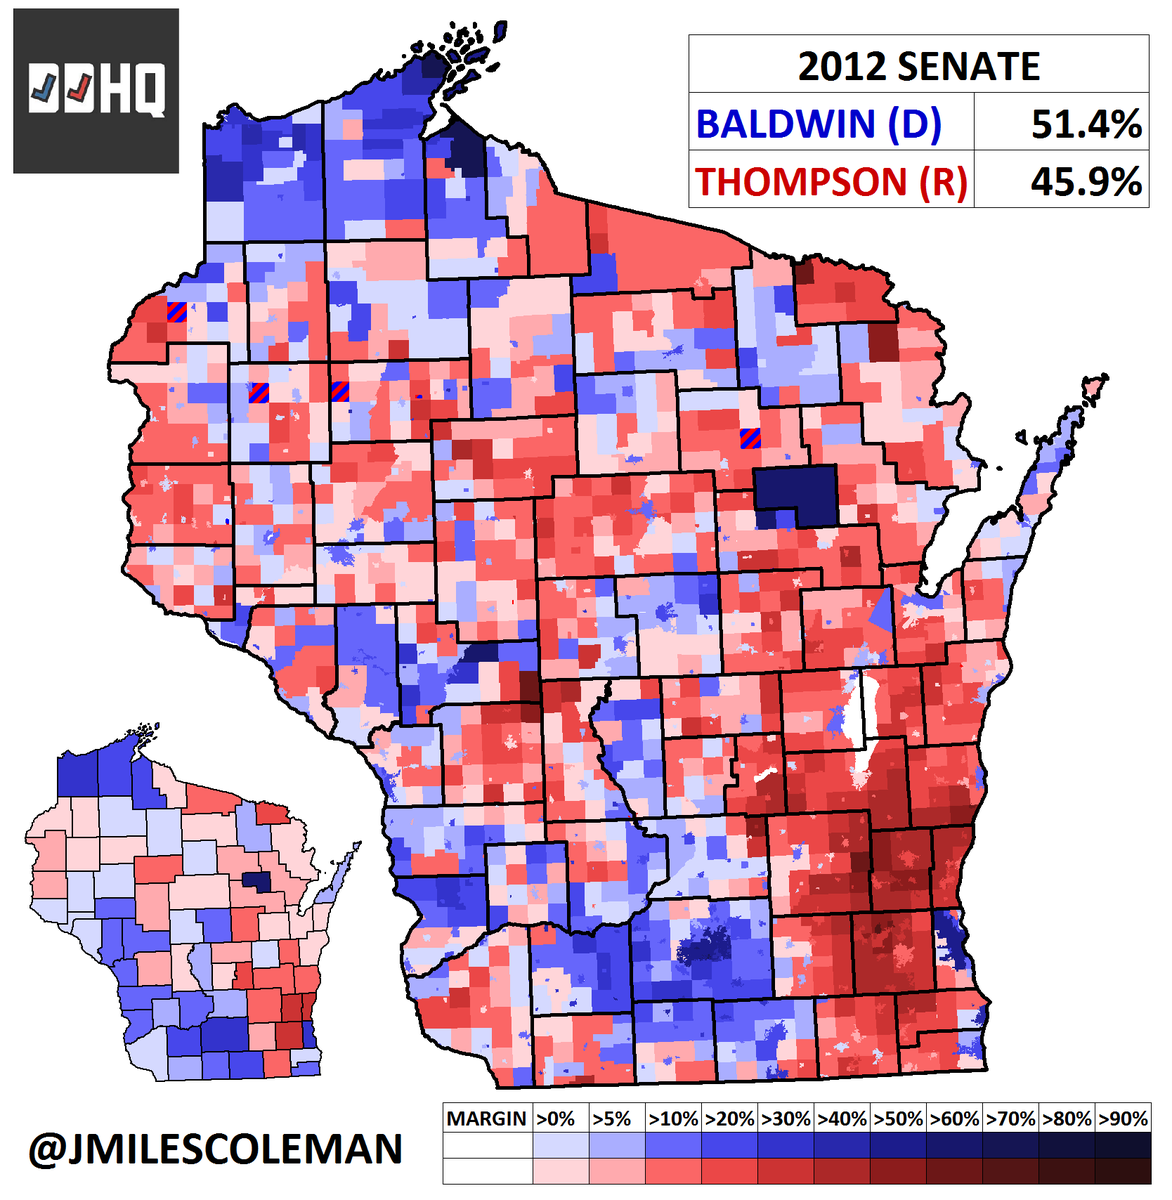
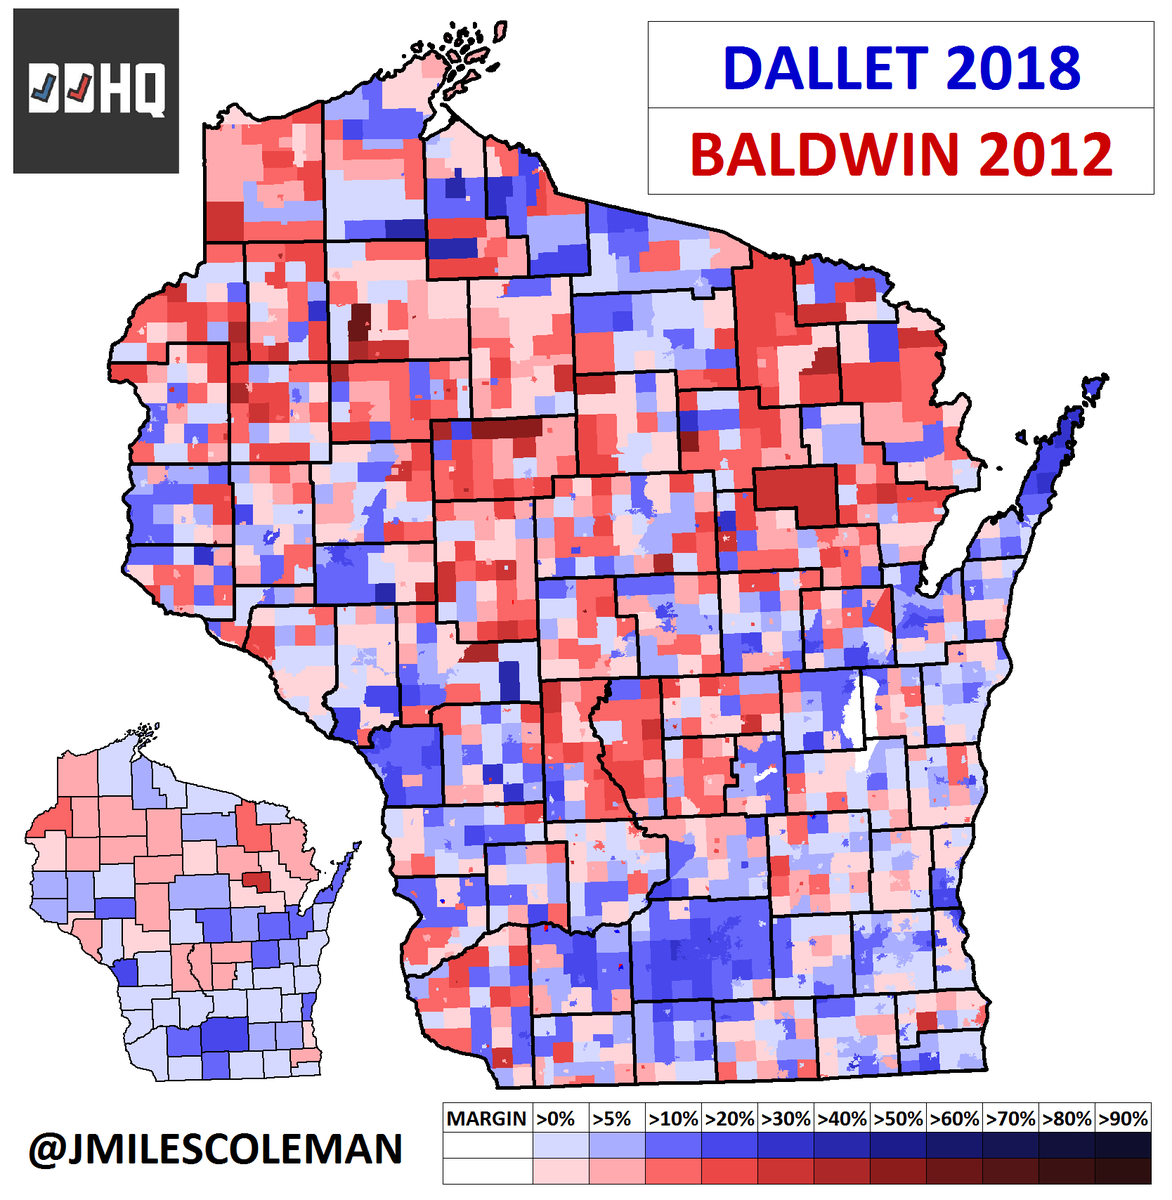
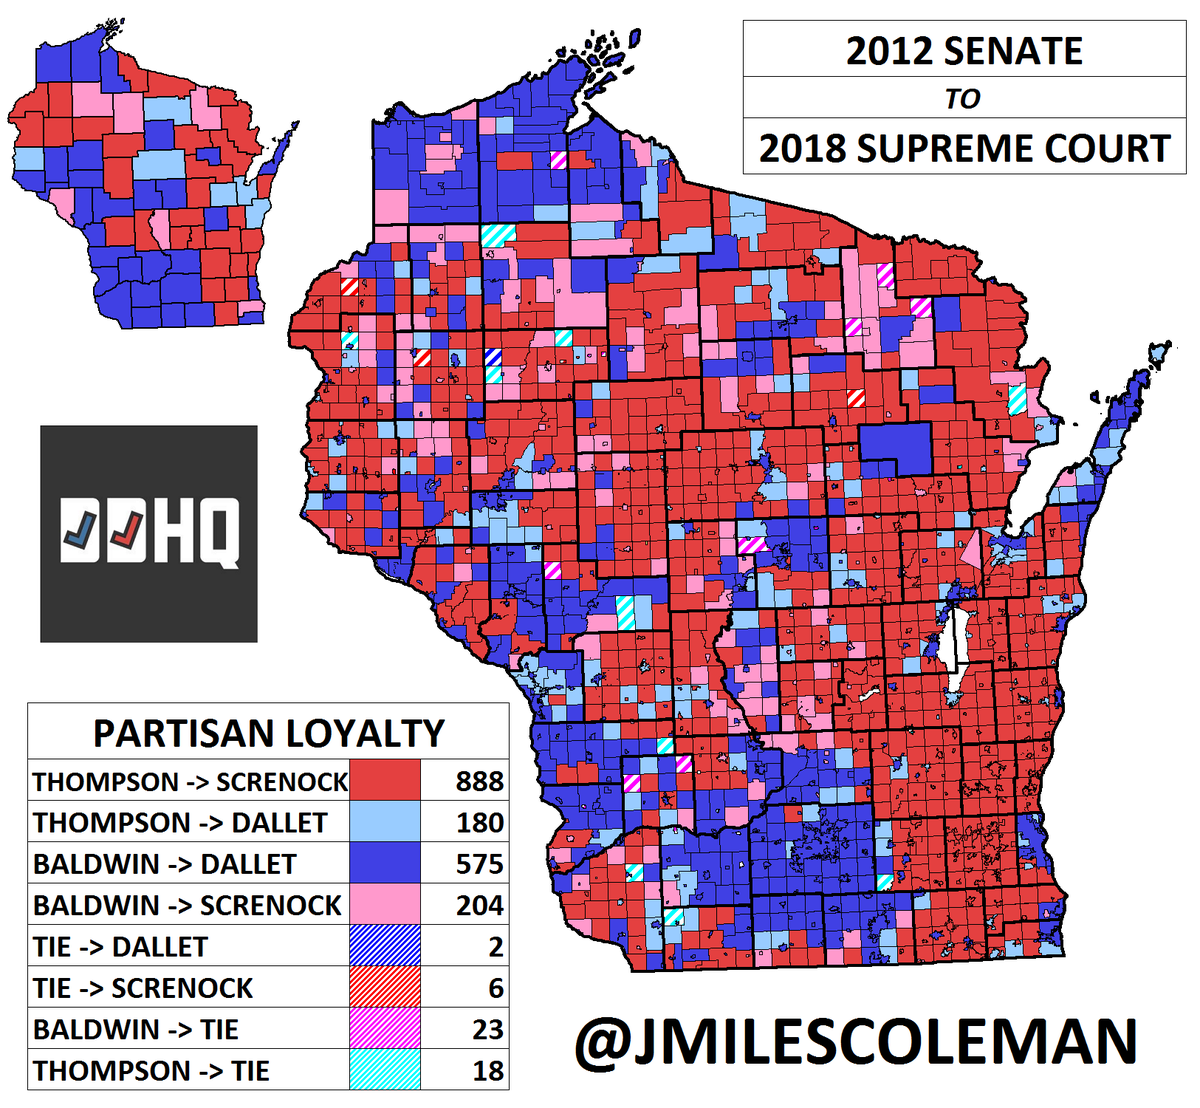
"Well, how bout Tammy Baldwin? She's up for reelection this year. Wasn't her last #WISen race in 2012 pretty competitive? What does the swing there look like?"
Baldwin beat ex-Gov. Tommy Thompson (R) by 5.5%. Like Feingold in '16, she had more rural appeal. As a result, this map is like Obama's, but w/ a more stark urban/rural split. e.g, compared to Obama's swing maps, note darker red in Forest Co., but deeper blues near Dane. #WISen
So yes guys, both Walker and Baldwin are up again this year. I'm sure after November, I'll be making more of these swing maps for those races. :)
#WISen #WIGov #wipolitics

• • •

Missing some Tweet in this thread? You can try to force a refresh
 

Keep Current with J. Miles Coleman

J. Miles Coleman Profile picture

Stay in touch and get notified when new unrolls are available from this author!

Read all threads

This Thread may be Removed Anytime!

PDF

Twitter may remove this content at anytime! Save it as PDF for later use!

Try unrolling a thread yourself!

how to unroll video
  1. Follow @ThreadReaderApp to mention us!

  2. From a Twitter thread mention us with a keyword "unroll"
@threadreaderapp unroll

Practice here first or read more on our help page!

More from @JMilesColeman

Jul 1, 2018
As Orange County, CA finished counting its primary ballots last week, we're going to be looking the House race in #CA45. This Congressional District is entirely in Orange County; it starts north in Anaheim, takes Irvine in the middle, and ends near Mission Viejo.
In 2016, Rep. Mimi Walters (R) won her second term by 17%. The district, which went to Romney in 2012, flipped to Clinton by almost 6%. Walters actually won more Clinton precincts than her Dem opponent, Ron Varasteh, did. #ca45
#CA45, like Orange County in general, has traditionally voted Republican. In fact, Clinton was the only recent statewide Democrat to carry it; even Obama and Feinstein lost it by double-digits. Still, the trend meant that Dems consider this seat a good pickup opportunity.
Read 8 tweets
Jan 15, 2018
Tonight on #ElectionTwitter, since NC may re-re-redistrict it's Cong. districts, we're gonna be looking back at the Congressional map that was in place from 2002 to 2010. #ncpol #ncga
Why this map? 1) It was drawn by Dems, and represents something of a best-case for them and 2) I've always liked this map, and usually end up breaking statewide races down under its lines, anyway. #ncpol #ncga
The 2001 Congressional map held up pretty well for Democrats. For example, they went into the red wave of 2010 holding 8 of 13 seats. They lost the House popular vote by 9% in NC, but of their seats, only #NC02 flipped R, and only barely. #ncpol
Read 6 tweets
Jan 7, 2018
Well guys, tonight on #ElectionTwitter, we're gonna be looking at Orange County. It's California's third most populous county and will be critical for the 2018 midterms.
Why is Orange County so interesting? Well, to start, it was one the relatively few Romney -> Clinton counties. She won it by almost 9%, becoming the first Democrat to carry it since FDR in 1936.
Despite the county flipping to Clinton, a quartet of districts there (or at least partially contained within OC) reelected R incumbents to Congress: #CA39, #CA45, #CA48, and #CA49.
Read 19 tweets

Did Thread Reader help you today?

Support us! We are indie developers!


This site is made by just two indie developers on a laptop doing marketing, support and development! Read more about the story.

Become a Premium Member ($3/month or $30/year) and get exclusive features!

Become Premium

Don't want to be a Premium member but still want to support us?

Make a small donation by buying us coffee ($5) or help with server cost ($10)

Donate via Paypal

Or Donate anonymously using crypto!

Ethereum

0xfe58350B80634f60Fa6Dc149a72b4DFbc17D341E copy

Bitcoin

3ATGMxNzCUFzxpMCHL5sWSt4DVtS8UqXpi copy

Thank you for your support!

Follow Us on Twitter!

:(