As Government and RBI now endorsed that there is a #CashCrunch, many theories are floating in the air about the reasons for the same.
@scroll_in published 15 theories about why we are facing a cash crunch now.
So let me float my own theory and examine some of the theories too!
@scroll_in published 15 theories about why we are facing a cash crunch now.
So let me float my own theory and examine some of the theories too!
One of the theory is that there is an unprecedented spur in withdrawal of the money from the banks. Also people refuse to deposit money in the banks.
Many factors are attributed for this theory; starting from the scary FDRI bill to Chota Modi Scams to Minimum balance looting..
Many factors are attributed for this theory; starting from the scary FDRI bill to Chota Modi Scams to Minimum balance looting..
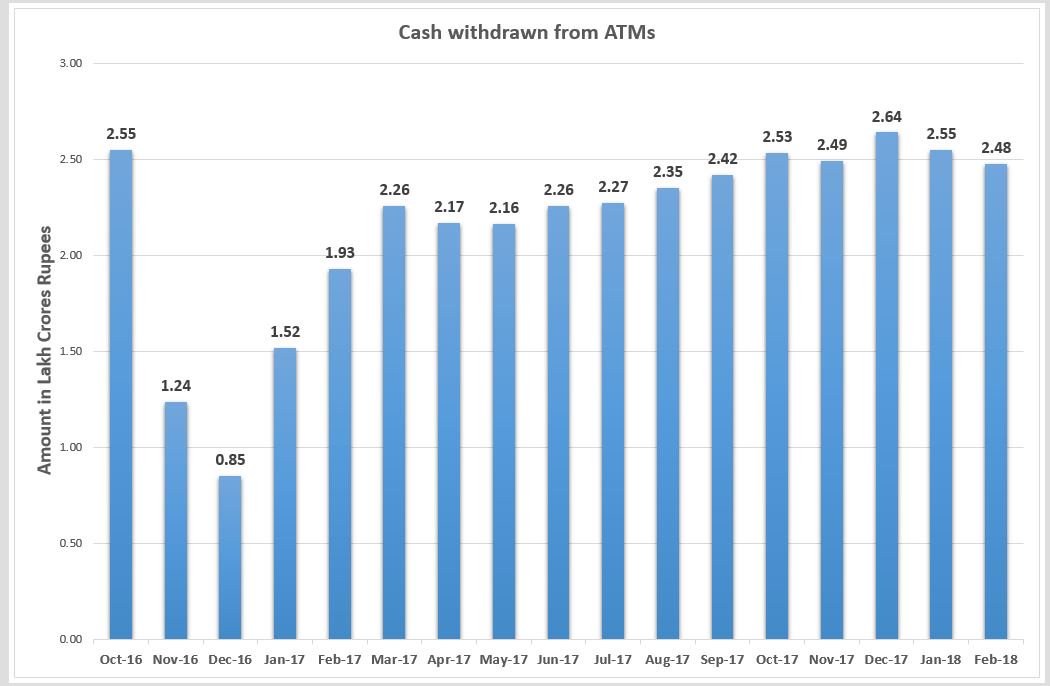
First examine, whether there is an unprecedented withdrawal from the banks for the last couple of months?
Let's see RBI data on withdrawal of currency through ATMs,, we have published data up to Feb 2018.
Do you see any spur here?
I am not seeing anything abnormal here!
Let's see RBI data on withdrawal of currency through ATMs,, we have published data up to Feb 2018.
Do you see any spur here?
I am not seeing anything abnormal here!
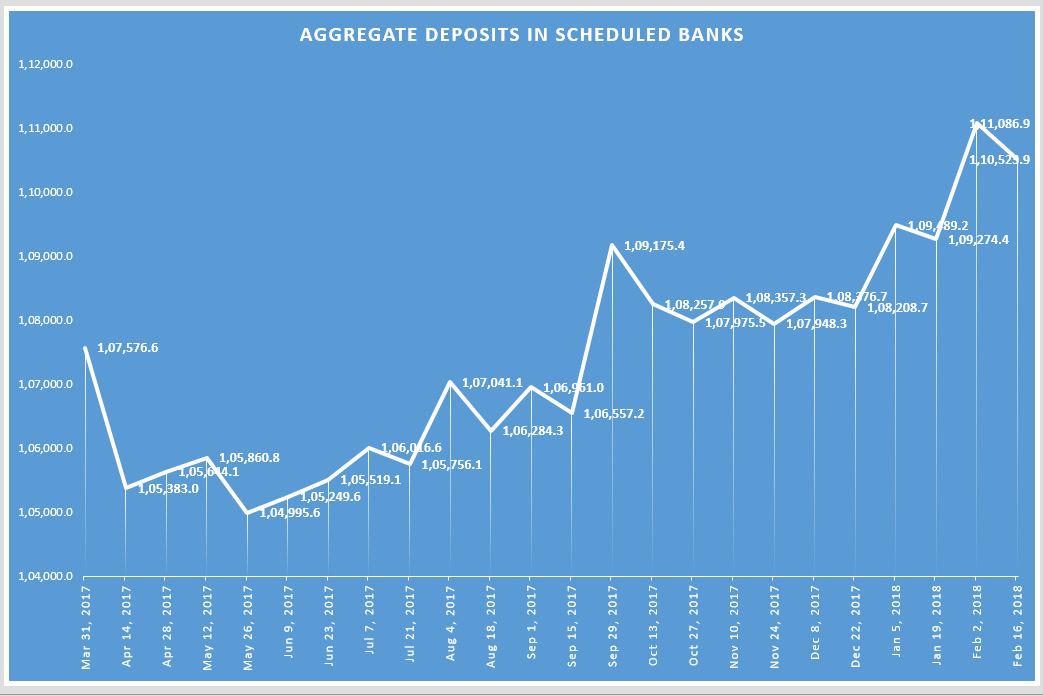
Now let's examine how the aggregate deposits with the scheduled banks for the last one year. RBI fortnightly data is available up to 16/02/2016, shown 56,300 crore fall
But see graph, more steep withdrawals happened in 4 occasions than this amount in past one year
But see graph, more steep withdrawals happened in 4 occasions than this amount in past one year
Between
31/03/17 & 14/4/17 - Rs. 2,19,350 crores
12/05/17 & 26/05/17 - Rs. 86,520 crores
04/08/17 & 18/08/17 - Rs. 75,680 crores
29/09/17 & 13/10/17 - Rs. 91,750 crores
Yep, all these figures are bigger than Rs. 56,300 crores. Then why did not ATMs run dry then?
31/03/17 & 14/4/17 - Rs. 2,19,350 crores
12/05/17 & 26/05/17 - Rs. 86,520 crores
04/08/17 & 18/08/17 - Rs. 75,680 crores
29/09/17 & 13/10/17 - Rs. 91,750 crores
Yep, all these figures are bigger than Rs. 56,300 crores. Then why did not ATMs run dry then?
Please see again the above figures especially when the recent spin is that the present crisis is due to a withdrawal of ₹45,000 crores in 3 weeks.
Troll army even accused @INCIndia done a clinically executed plan to dry out ATMs.
Troll army even accused @INCIndia done a clinically executed plan to dry out ATMs.
So the people did not withdraw money in a scary manner from their accounts, at least on national level, if the above data points are considered. Also remember that FDRI bill was a news in December 2017.
So reach your own judgment based on data about the above theories!
So reach your own judgment based on data about the above theories!
Now look at the Currency in Circulation Vs Nominal GDP data, which is one of the most important factor, which governs how much currency is needed in the system. This is available in page 219, Annual Report 2016-17.
We can see that except 2016-17, average CIC-GDP ratio is 11.9%
We can see that except 2016-17, average CIC-GDP ratio is 11.9%
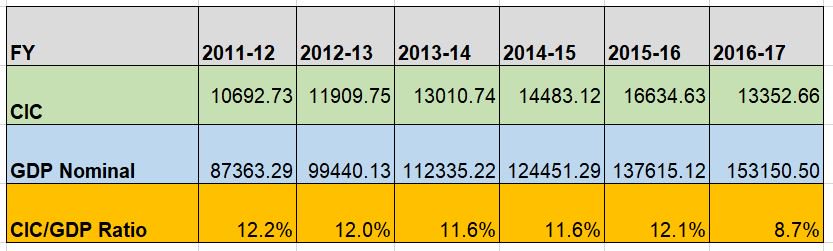
Why CIC-GDP ratio of 2016-17 was low? Because the CIC was not recouped because of printing blues and it was just ₹13.35 lakh crores as on 31/03/17.
We witnessed how it shattered this our economy & GDP growth.
We witnessed how it shattered this our economy & GDP growth.
Many of us believe or take shelter under the belief that the digital transactions growth took a leapfrog. Hence we don't need the earlier CIC-GDP ratio.
Hence it warrants a closer examination of the digital growth during pre-Demon and post-DeMon periods.
Hence it warrants a closer examination of the digital growth during pre-Demon and post-DeMon periods.
I have taken the retail digital transactions which are used for comparison by RBI in its bulletin & annual reports. This includes NEFT, NACH, ECS, IMPS, Credit & Debit Cards POS transactions, PPIs and Mobile Banking.
UPI data is not added to this. That will be explained later.
UPI data is not added to this. That will be explained later.
We will get RBI data upto Feb, 2018, so I done an extrapolation of the same growth of 11 months to full year for 2017-18.
We can see that the digital transaction growth is now shrunk to 36% in last year after reaching a peak of 53% in 2016-17 due to lack of choice during DeMon
We can see that the digital transaction growth is now shrunk to 36% in last year after reaching a peak of 53% in 2016-17 due to lack of choice during DeMon
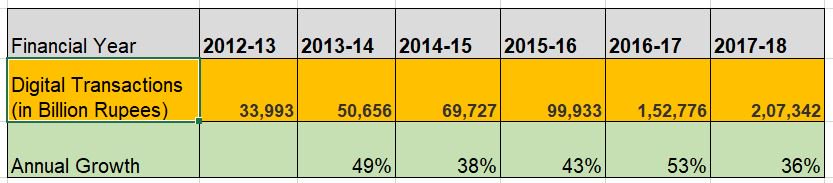
We can see that the secular average annual digital transactions growth is 44% for past 5 years and the average digital transaction growth for past 2 years are also the same 44%.
Now comes to the point of why I have not taken the much hyped UPI value here.
Now comes to the point of why I have not taken the much hyped UPI value here.
As per NPCI website, the annual UPI transaction value for 2017-18 is Rs. 1098.32 billion, which is just 0.53% of the total retail digital transactions for 2017-18 amounting Rs. 2,07,342 billion. Since this figure is insignificant, RBI is yet to consider it for its analysis.
Now come to the cream of the argument. Let's combine the above two tables to understand the effect of CIC-GDP ratio and digital transaction growth.
This table needs a closer examination to understand the nuances of the present problem.
This table needs a closer examination to understand the nuances of the present problem.
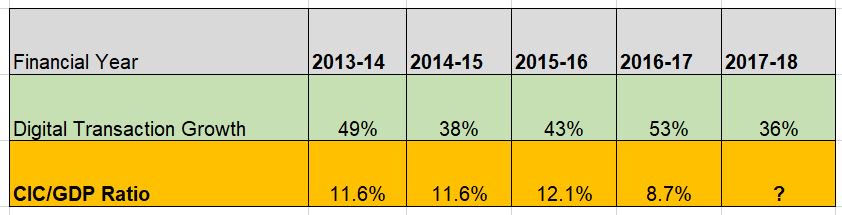
Let me share my inferences. Even when the digital transactions grown at 49% in 2013-14, CIC-GDP ratio was 11.6%. It continued in next year & recorded 12.1% in 2015-16.
Same Government with same digital growth, maintained a CIC-GDP ratio between 11.6%-12.1% before demonetisation.
Same Government with same digital growth, maintained a CIC-GDP ratio between 11.6%-12.1% before demonetisation.
But due to printing blues, RBI was not able to print enough currency in 2016-17 and hence the CIC-GDP ratio fell to 8.7%, which was a temporary phenomenon. Because the 53% digital growth in that year was not so spectacular to squeeze CIC-GDP ratio!
Now this year, the digital growth is 38%, so let's examine what is the CIC-GDP ratio. RBI/CSO gives you nominal GDP figures up to Q3. I have extrapolated Q4 with 12% growth than Q4 for last year since Q3 growth was 11.9%.
So total estimated nominal GDP for this year is 169.76 LC
So total estimated nominal GDP for this year is 169.76 LC
As the CIC as on 31/3/18 was 18.293 LC, this year's CIC-GDP ratio would be just 10.8%!
We seen that as digital growth remains almost same in pre & post DeMon periods, to have a smooth economic activity we need around 11.8% average CIC-GDP ratio.
We seen that as digital growth remains almost same in pre & post DeMon periods, to have a smooth economic activity we need around 11.8% average CIC-GDP ratio.
That means a healthy CIC is 169.76 LC x 11.8% = ₹20. 03 LC!
But we are having only ₹18.425 LC as on 06/04/18..
We still need at least ₹1.5 LC now to ease the #CashCrunch
But we are having only ₹18.425 LC as on 06/04/18..
We still need at least ₹1.5 LC now to ease the #CashCrunch
After spins and denials, Government is finally giving up and agrees that we need more CIC in the system. See they are now ready to pump ₹75,000 crores into the system
External Tweet loading...
If nothing shows, it may have been deleted
by @ANI view original on Twitter
In hindsight, we can see that the Government was incompetent and clueless from day one about this stupid exercise called demonetisation!
But their hubris did not allow them to accept their monumental blunder.
But their hubris did not allow them to accept their monumental blunder.
Firstly, they never thought about the devastating effect of this Tuglak experiment on the economy.
Secondly, they don't even take stock of their printing capabilities
Then, ₹2000 notes became a pain in their neck.. No change for it & facilitated the more efficient hoarding
Secondly, they don't even take stock of their printing capabilities
Then, ₹2000 notes became a pain in their neck.. No change for it & facilitated the more efficient hoarding
Then, they tried to lure, arm twist us to switch to the digital Utopia for last 1.5 years! Not ready to acknowledge the infrastructure limitations in the rural India.. How much energy they wasted for this Utopian dream!
It was very much possible for the Government to restore the normalcy after 9 months, but like a wicked child they wasted another 9 more months!! They killed the rural & informal economy and India's growth story.
But hagiographers still singing praise songs of the DeMon! 🤣
But hagiographers still singing praise songs of the DeMon! 🤣
So my theory is simple. We are not having enough CIC in the system. I tweeted this many months back and predicted that if RBI is not pushing enough currency, we are going to witness a #CashCrunch. Sadly my words turns so prophetic!
And I have a conspiracy theory too share with you.
Why the Government now ready to print currency after being obdurate for quite long time.
RBI Annual Report for 2017-18, which will come in next September show only 10.8% CIC-GDP ratio.
Why the Government now ready to print currency after being obdurate for quite long time.
RBI Annual Report for 2017-18, which will come in next September show only 10.8% CIC-GDP ratio.
But this year when the CIC-GDP ratio will revert back to its normal, but we will know that officially only in 2019 September.. By the time the elections will be over.
As long as Report is not in public domain, it's easy for spin masters to manipulate 😜
As long as Report is not in public domain, it's easy for spin masters to manipulate 😜
I will revisit my extrapolation of digital transactions for March and GDP figures for Q4 as soon as official data will be released. I don't think there is not going to be any significant changes in my inferences.
Good night!!
Good night!!
PS: Kindly understand that #CashCrunch is not an overnight phenomenon, this was known to RBI for months. But they failed to act as they no more taking professional decision making based on inputs from their experts instead they dance to the tunes of Babus in MoF.
• • •
Missing some Tweet in this thread? You can try to
force a refresh