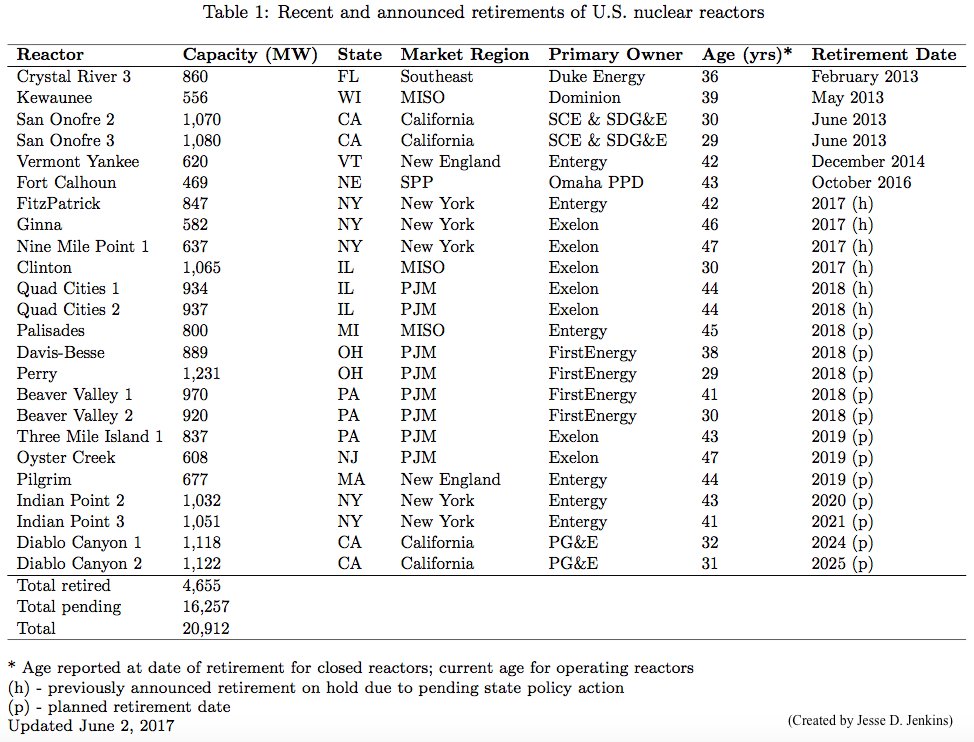
Six #nuclear reactors closed since 2013. By my count, up to 23 more reactors may retire w/o policy or market conditions improving: 21.6 GW = ~1/5th of US fleet, 4% of US #electricity--and crucially, 12% of emissions-free generation.
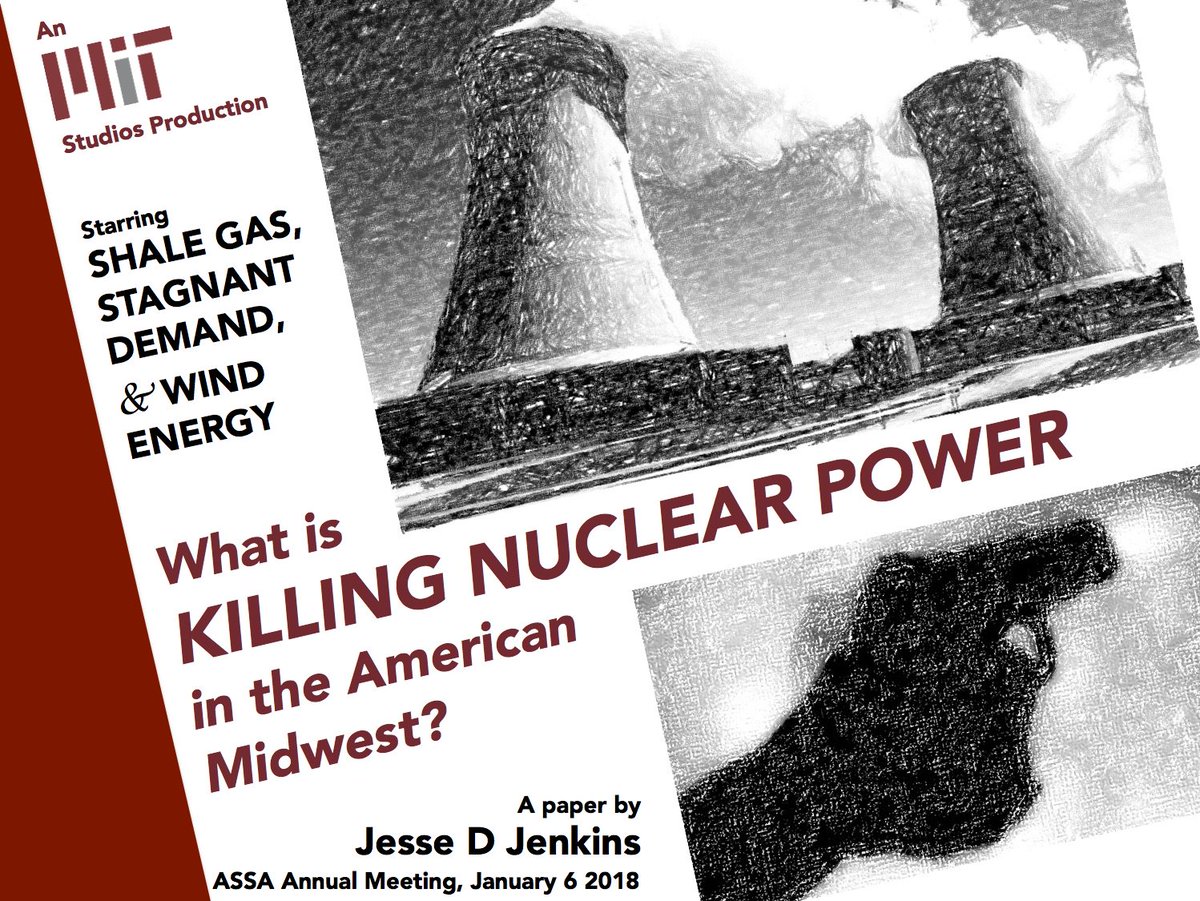
So what's killing nuclear power in the U.S.?
So what's killing nuclear power in the U.S.?
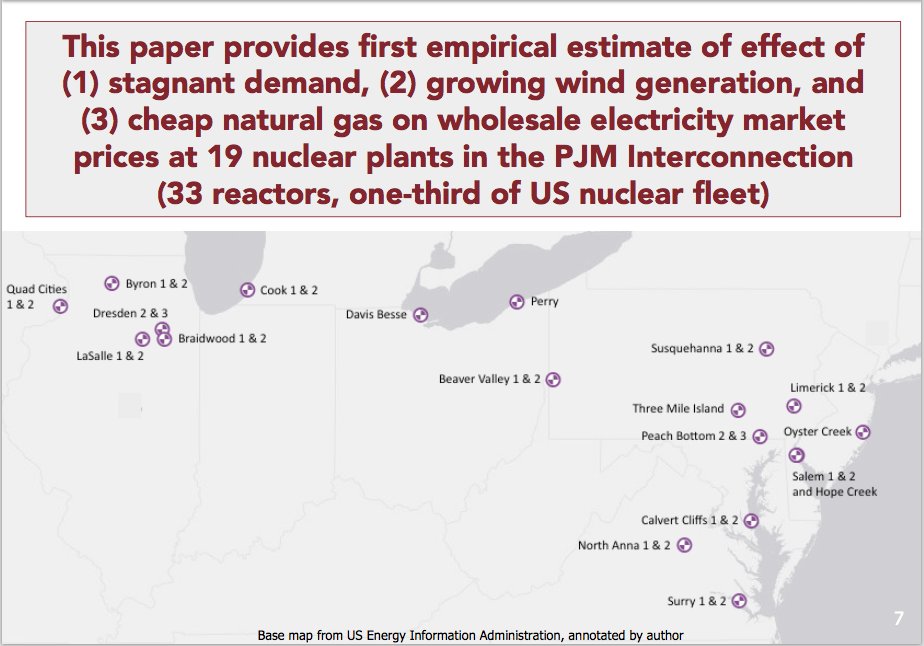
In a new @MIT CEEPR paper -- 1 part #energy #economics & 1 part film noir murder mystery! -- I provide the 1st empirical estimates of what's driving down #electricity market prices & killing profitability of 19 #nuclear power plants across @pjminterconnect ceepr.mit.edu/publications/w…
You can read a short policy brief summarizing the paper & key conclusions @MIT CEEPR here: ceepr.mit.edu/files/papers/2…
Abstract & paper here: ceepr.mit.edu/publications/w…
Slides presented at #ASSA2018 here: dropbox.com/s/b6192hrvn331…
Abstract & paper here: ceepr.mit.edu/publications/w…
Slides presented at #ASSA2018 here: dropbox.com/s/b6192hrvn331…
(Unfortunately, the full paper is only currently available publicly to CEEPR members. Please message or email me if you need a copy sooner.)
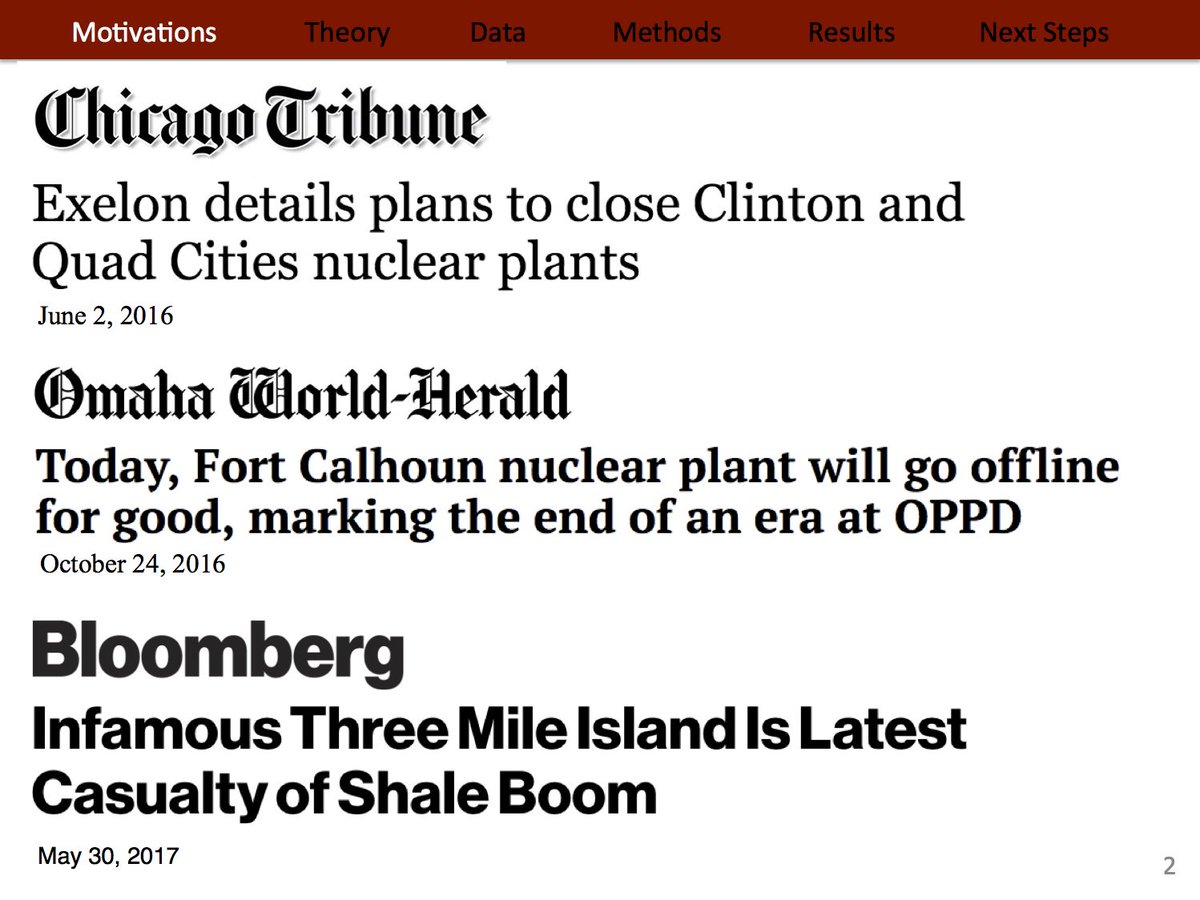
You've all seen the headlines: with wholesale electricity prices at historic lows, #nuclear plants across the U.S. have announced plans to close unless market conditions improve or policy makers take action.
NY & IL have already intervened. CT, NJ, others debating action now.
NY & IL have already intervened. CT, NJ, others debating action now.
Average day-ahead #electricity prices across @pjminterconnect fell 55% from 2008 to 2016. 1/2 (BNEF, 2016) to 2/3 (Haratyk, 2017) of US #nuclear plants may be operating at a loss in current market conditions.
But what forces are really to blame for driving nuclear to the brink?
But what forces are really to blame for driving nuclear to the brink?
Some blame growth of #wind #energy for driving down prices & distorting markets due to subsidies. Remember: Sect. Perry kicked off DOE's efforts to intervene in electricity markets in April 2017 by citing "market-distorting effects" of renewable energy subsidies...

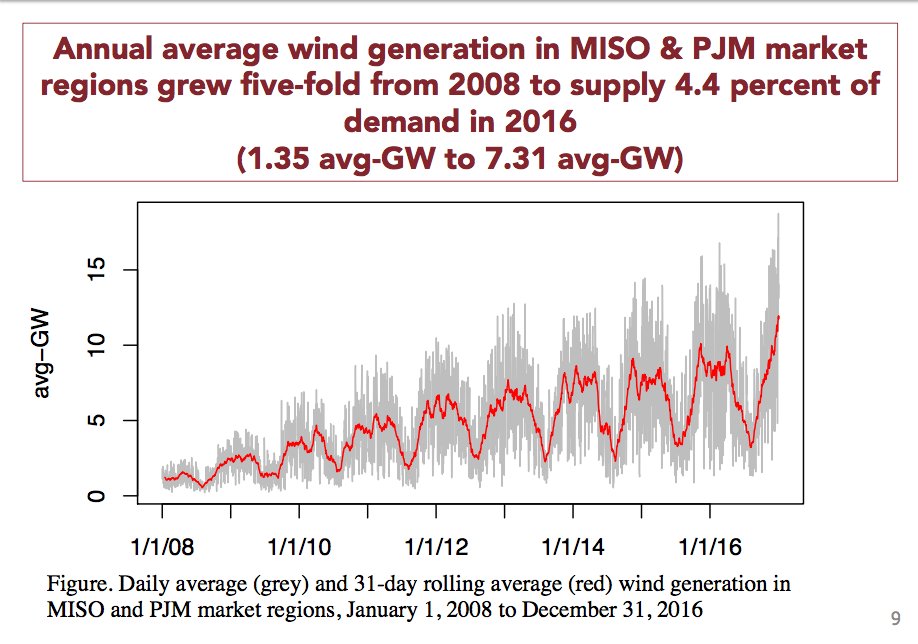
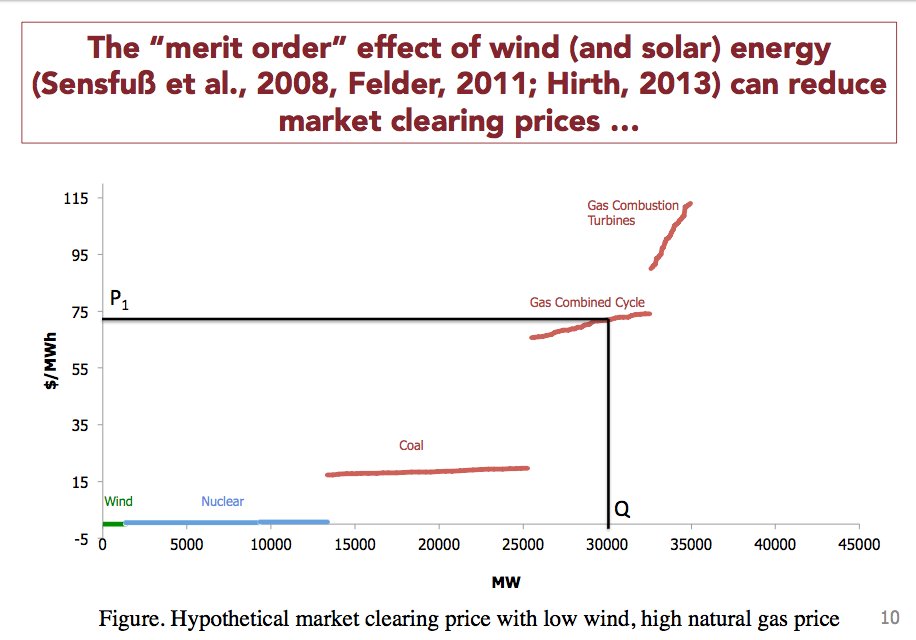
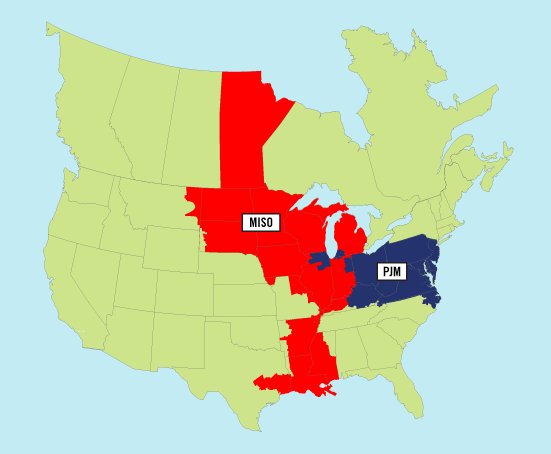
#Wind #energy did grow 5-fold from 2008 to supply 4.4% of electricity demand in states served by PJM & neighboring MISO. Energy economists have documented the "merit order" effect of #renewableenergy on market prices, so wind is at least a plausible suspect int his mystery.
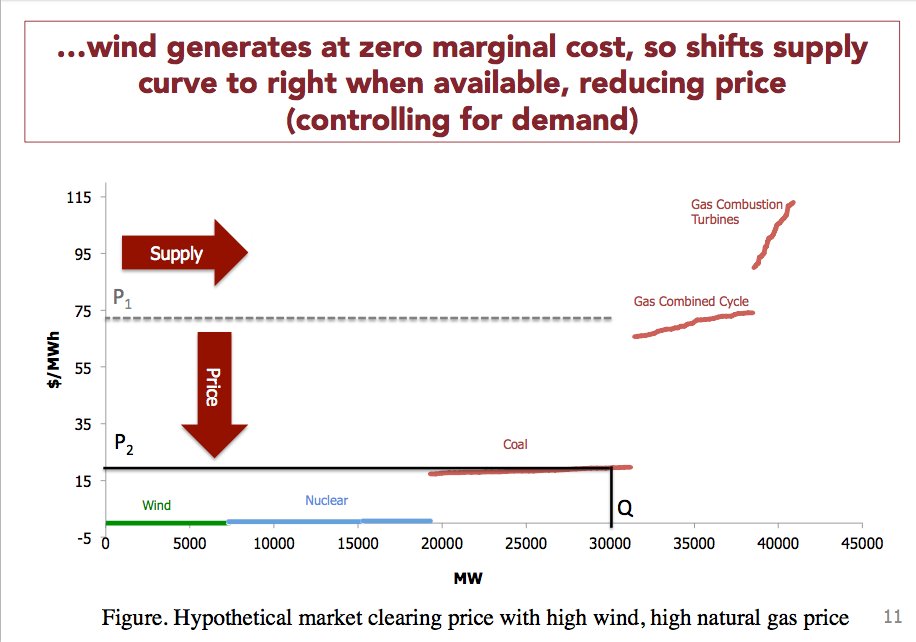
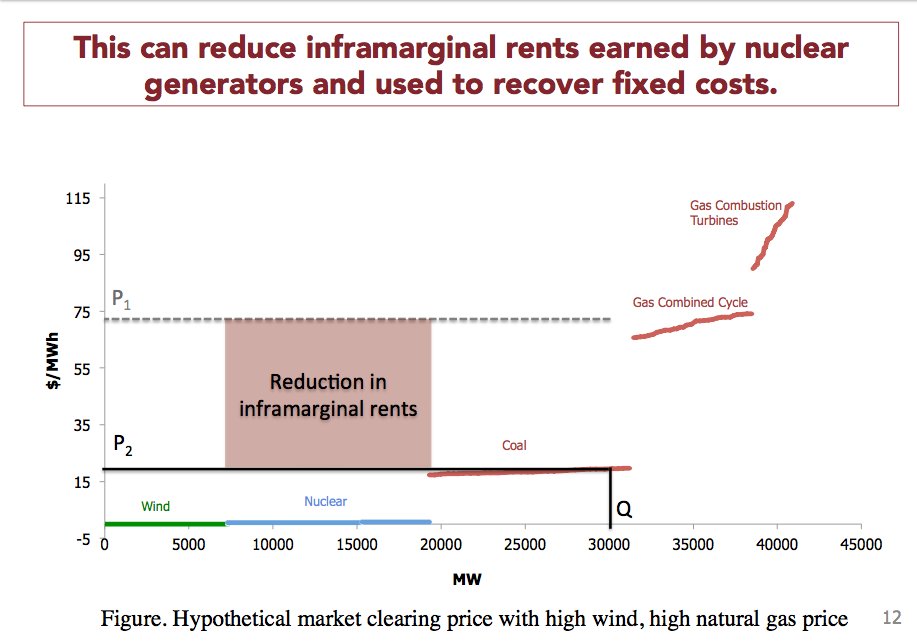
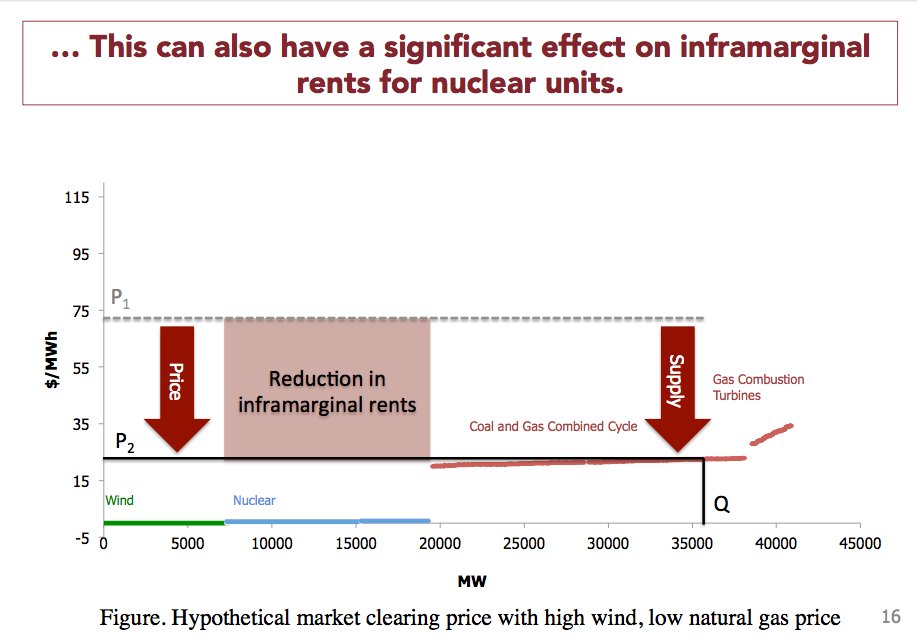
Here's a depiction of how the "merit order effect" works: (1) Wind or solar shift supply curve to right whenever they generate. (2) That lowers power prices (all else equal). (3) That reduces "inframarginal rents" used by other generators to cover their fixed costs.
So is #wind #energy killing #nuclear like Sect. Perry and others allege?
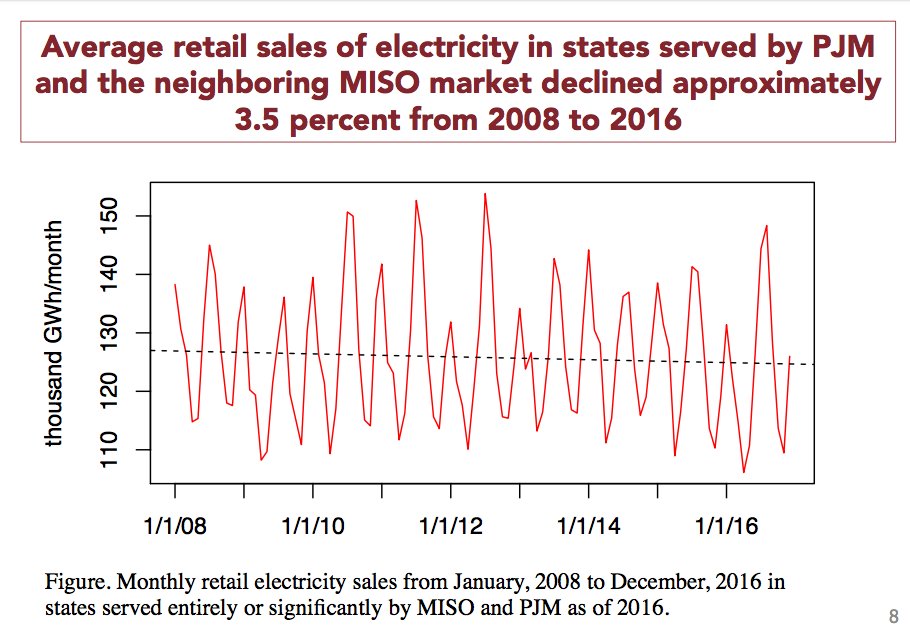
There are at least two other suspects in this case: stagnant demand for #electricity after the Great Recession and cheap #naturalgas unlocked by the boom in #shalegas production.
There are at least two other suspects in this case: stagnant demand for #electricity after the Great Recession and cheap #naturalgas unlocked by the boom in #shalegas production.

Demand for electricity declined 3.5% form 2008 to 2016 across states served by MISO & PJM.
Lower demand obviously means lower prices. Straightforward effect. So that's suspect #2.
Lower demand obviously means lower prices. Straightforward effect. So that's suspect #2.
Suspect #3: Cheap natural gas!
Despite Perry's assertions, DOE's "baseload review" concluded gas was biggest factor driving #coal or #nuclear plants offline energy.gov/staff-report-s…
Simulations by Haratyk at MIT sciencedirect.com/science/articl… & LBNL/ANL agree emp.lbl.gov/sites/default/…
Despite Perry's assertions, DOE's "baseload review" concluded gas was biggest factor driving #coal or #nuclear plants offline energy.gov/staff-report-s…
Simulations by Haratyk at MIT sciencedirect.com/science/articl… & LBNL/ANL agree emp.lbl.gov/sites/default/…
Cheaper natural gas shifts the #electricity supply curve down, leading to lower clearing prices at a given level of demand (all else equal). This also can have a dramatic effect on inframarginal rents earned by nuclear and other inframarginal generators.
So cheap gas, lower demand & growing wind energy are all suspects in the case & have clear mechanisms to drive down prices earned by #nuclear in US #electricity markets.
My paper provides the first empirical evidence in this case, focusing on 19 nuclear plants in PJM market.
My paper provides the first empirical evidence in this case, focusing on 19 nuclear plants in PJM market.
I use hourly electricity price, wind generation, and demand data from PJM & MISO markets and daily gas prices from SNL to construct a complete time series of average daily observations for all 3 "suspects" from Jan 1 2008 to Dec 31 2016 (n=3,288).
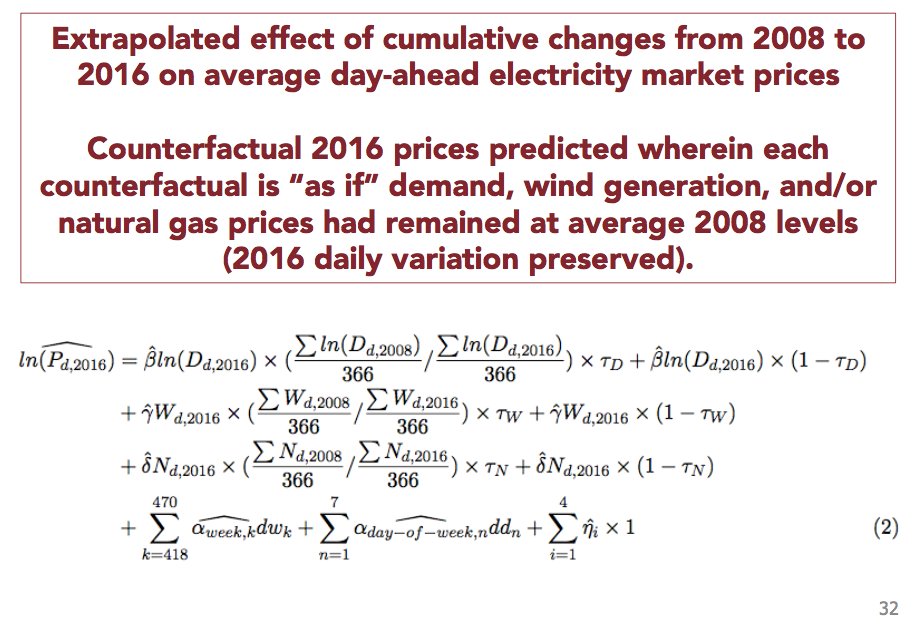
I then regress day-ahead electricity prices at each PJM nuclear plant on changes in demand, wind and gas price with time fixed effects (for week-in-series and day-of-week) to account for unobserved time varying confounders. Here's the primary specification...
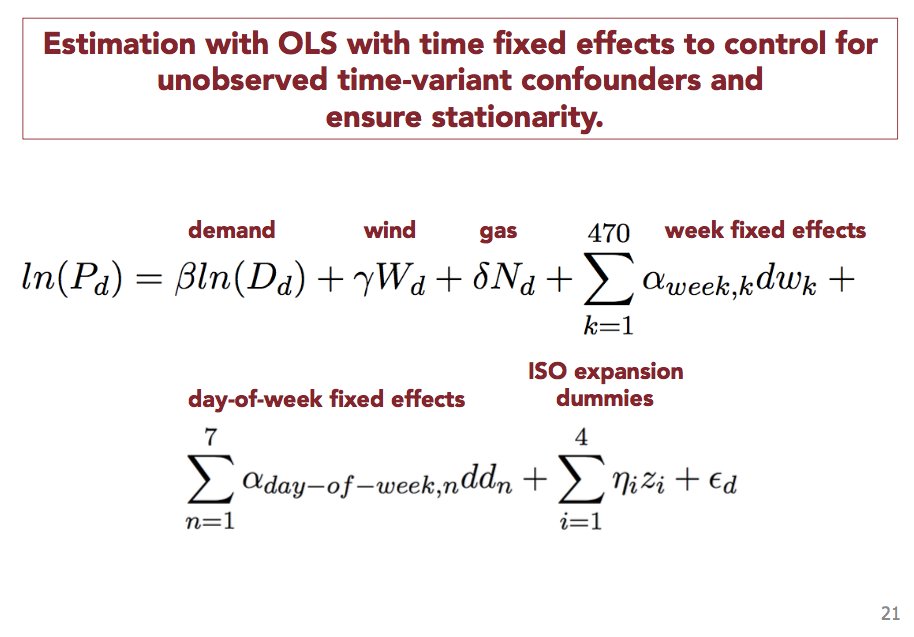
(More technical details for the economists out there in my #ASSA2018 presentation dropbox.com/s/b6192hrvn331… or email me for full paper)
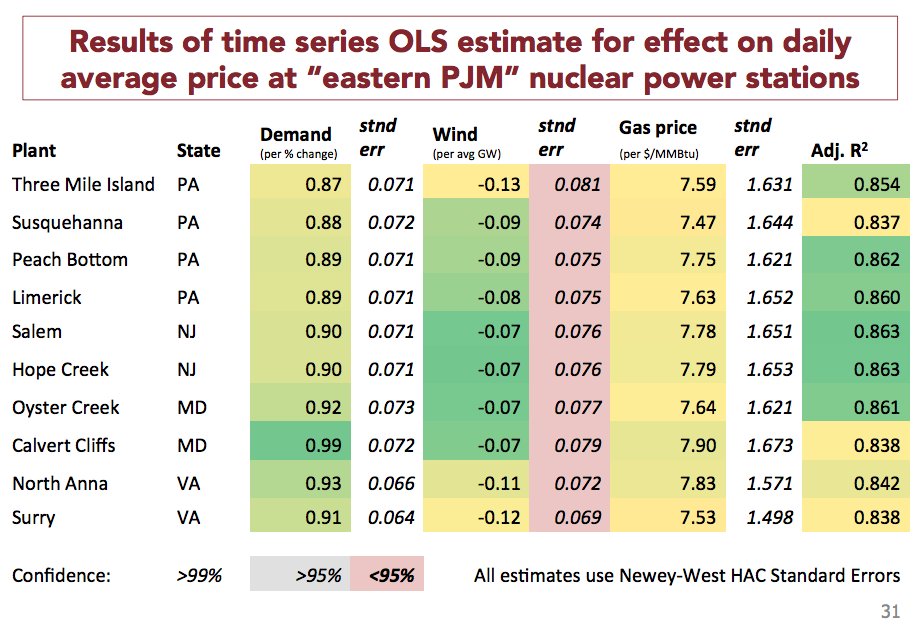
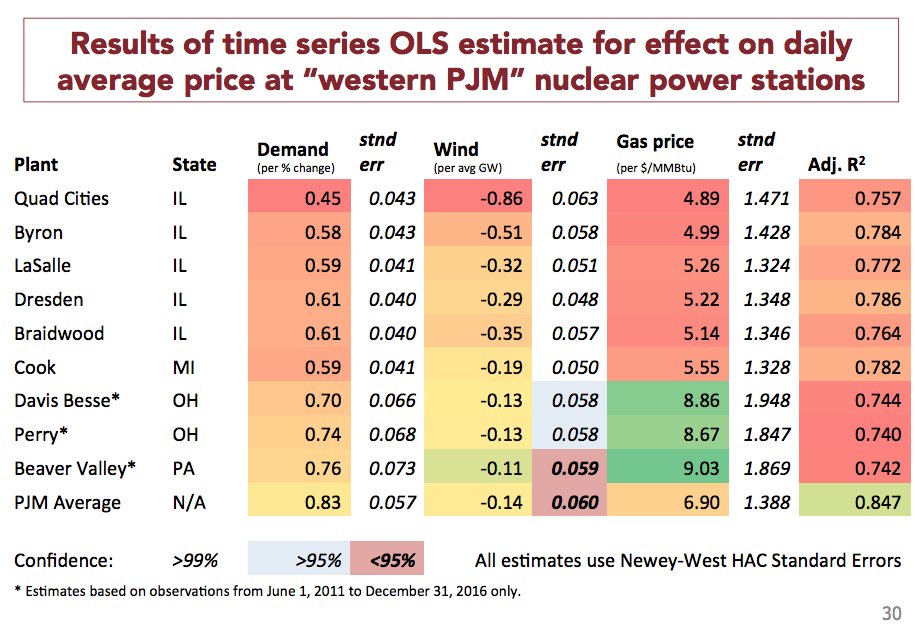
Here are the estimated causal effects (and standard errors) of demand (per % change), wind (in average-GW of daily generation), and natural gas price (per $/MMBtu) on electricity market prices at location each PJM nuclear plant. Effects expressed as % changes in price.
Using these coefficients, I estimate the cumulative impact of each "suspect" on prices at PJM nuclear plants by constructing a counterfactual "what if" scenario for 2016, “as if” demand, wind, and/or gas prices had remained at average 2008 levels (2016 daily variation preserved).
And now, the moment the jury has been waiting for: what killed power prices for nuclear plants in PJM from 2008 to 2016?
Here are my primary results.
The graphic makes it obvious: natural gas is the main killer. Effect of gas is order of magnitude larger than wind or demand.
Here are my primary results.
The graphic makes it obvious: natural gas is the main killer. Effect of gas is order of magnitude larger than wind or demand.
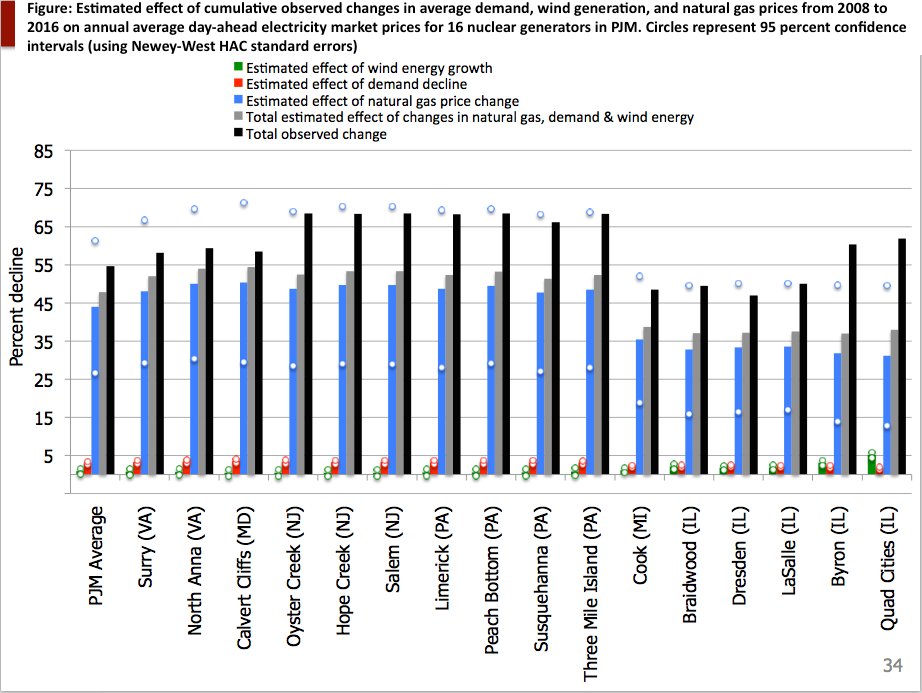
(Quick note: First Energy's plants, Beaver Valley, Davis Besse and Perry, joined PJM in 2012, so I cant/dont estimate cumulative 2008 to 2016 impact for these three, hence 16 plants in the graphic but 19 in the paper/regression results).
A 3.5% decline in electricity demand across PJM & MISO from 2008-2016 reduces prices at PJM nuclear plants by a few percent (greater effect in east closer to demand). Prices would have been 1.5-4% higher if demand stayed at 2008 levels (statistically significant at all plants).
Importantly, and in rebuttal to Sect. Perry or others asserting #wind is killing #nuclear, the 5-fold growth in wind generation in MISO & PJM from 2008-2016 has a statistically significant (and modest) effect ONLY on nuclear plants in western PJM (IL & to lesser degree MI & OH).
For nuclear plants in Illinois, Michigan and Ohio, growth of wind has a similar effect as decline in demand, reducing average prices by ~1-6% from 2008 to 2016.
For ALL OTHER nuclear plants in PJM, wind does not appear to have statistically significant effect on prices earned.
For ALL OTHER nuclear plants in PJM, wind does not appear to have statistically significant effect on prices earned.
My explanation as to why: frequent transmission congestion btwn eastern PJM & western portions closely coupled w/MISO insulate plants in east from impacts of demand or wind in west. In paper, I further disaggregate wind/demand by ISO region, providing evidence for this hypothesis
Note that my estimates for wind and demand are pretty precise (e.g. very small standard errors/confidence intervals). So these point estimates are pretty accurate/dependable I think. Lots of variation in the wind and demand time series to exploit in regression.
However, there is much less variation in the natural gas price series to exploit. As a result, the estimated effect of natural gas is much less precise: note wide 95% confidence intervals in results above. So treat point estimates for gas with more caution & note conf. interval.
Despite this variance in estimated gas effect, one can confidently conclude that the impact of declining gas prices on nuclear plant revenues in PJM is an order of magnitude greater than the impact of either declining electricity demand or the growth in wind energy generation.
Changes in natural gas prices also appear to have had a greater impact on prices earned by nuclear plants in the eastern portion of PJM (closer to Marcellus?), although effects are large and statistically significant for all plants in the PJM footprint.
(In the paper, I also explore alternative specifications using gas prices series from "local" trading hubs in PJM region, such as Chicago & Columbia hubs. Primary specification uses Henry Hub. Gas point estimates change somewhat, but w/in standard errors of primary specification)
In short, cheap natural gas appears to be killing the profitability of nuclear power producers in the PJM Interconnection.
That said, stagnant electricity demand and expectations of future growth in wind generation going forward may be accomplices.
Case closed? /end
That said, stagnant electricity demand and expectations of future growth in wind generation going forward may be accomplices.
Case closed? /end
Addendum: Please note that for nuclear plants in MISO, the effect of wind on prices is likely larger than PJM plants here. More in line with what I see for Quad Cities other Illinois plants I would guess, but I have not directly estimated effects for MISO plants.
Given proximity to wind generation, the impact of growing wind energy for MISO nuclear plants is likely larger than for most of the PJM plants. Based on my results, however, I would hypothesize the effect is still unlikely to be of same order of magnitude as decline in gas price.
PS corrected link to ASSA presentation here https://t.co/11PbRzKwm5?amp=1
Link in thread above is unfortunately broken.
Link in thread above is unfortunately broken.
• • •
Missing some Tweet in this thread? You can try to
force a refresh