Discover and read the best of Twitter Threads about #datavisualization
Most recents (2)
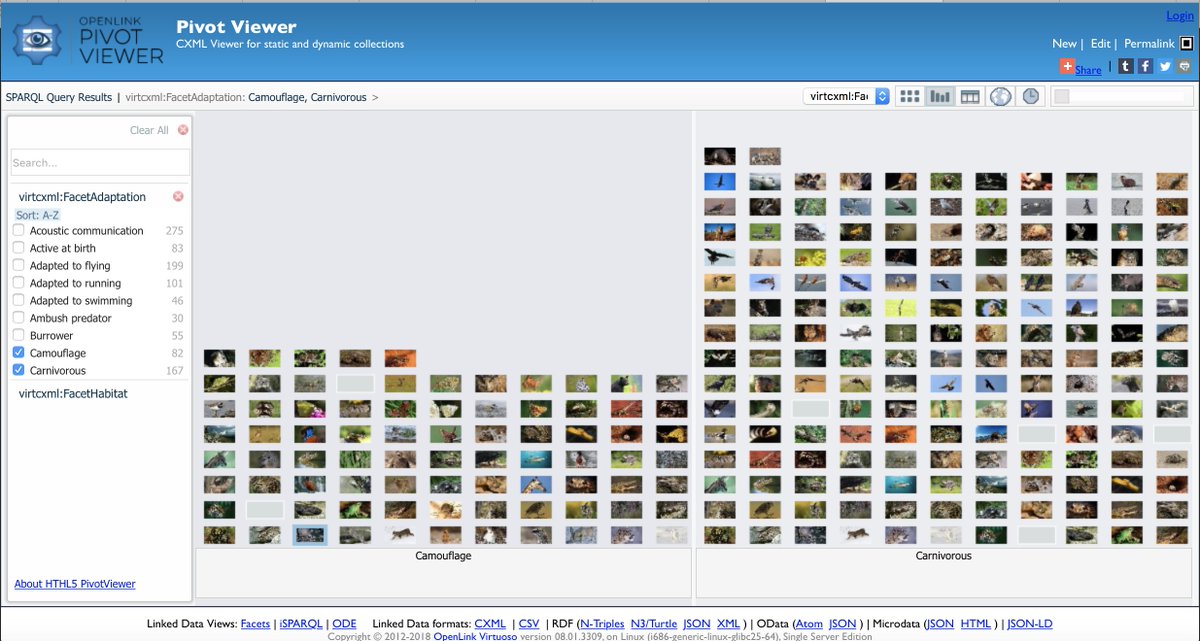
Here's what happens when the combined prowess of #CSV #RDF intersect i.e., generation of a #SemanticWeb of #LinkedData visualized using our #HTML5 #PivotViewer: linkeddata.uriburner.com/HtmlPivotViewe…
This is an utlra flexible visual drill-down :)
#DataVisualization #GraphDatabases #RDBMS


This is an utlra flexible visual drill-down :)
#DataVisualization #GraphDatabases #RDBMS
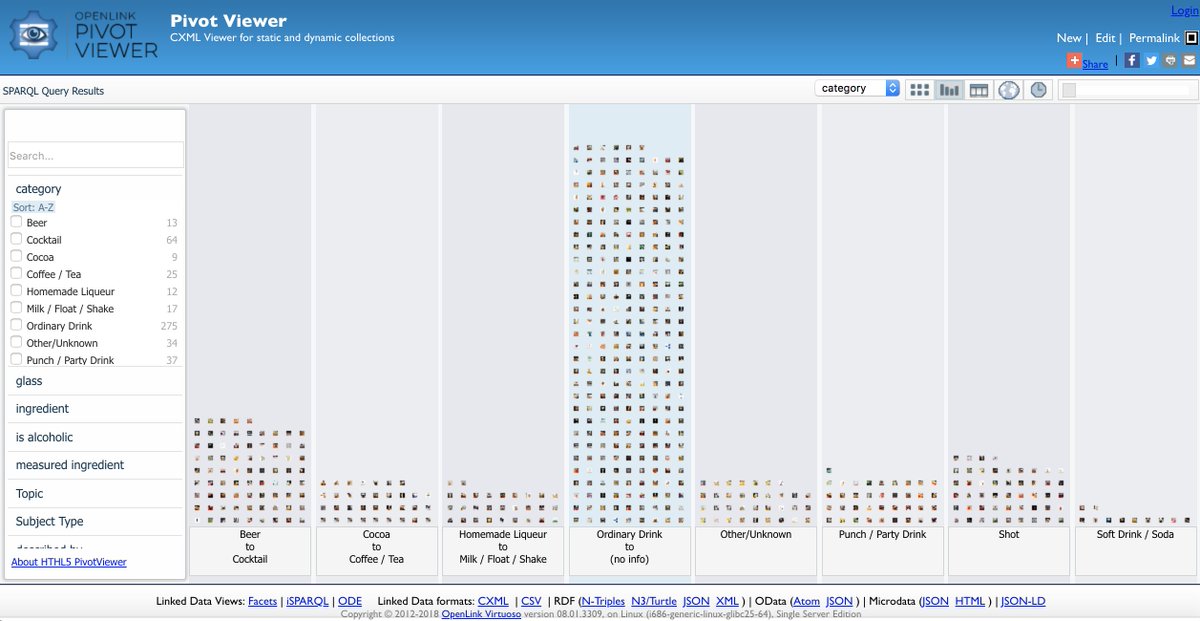
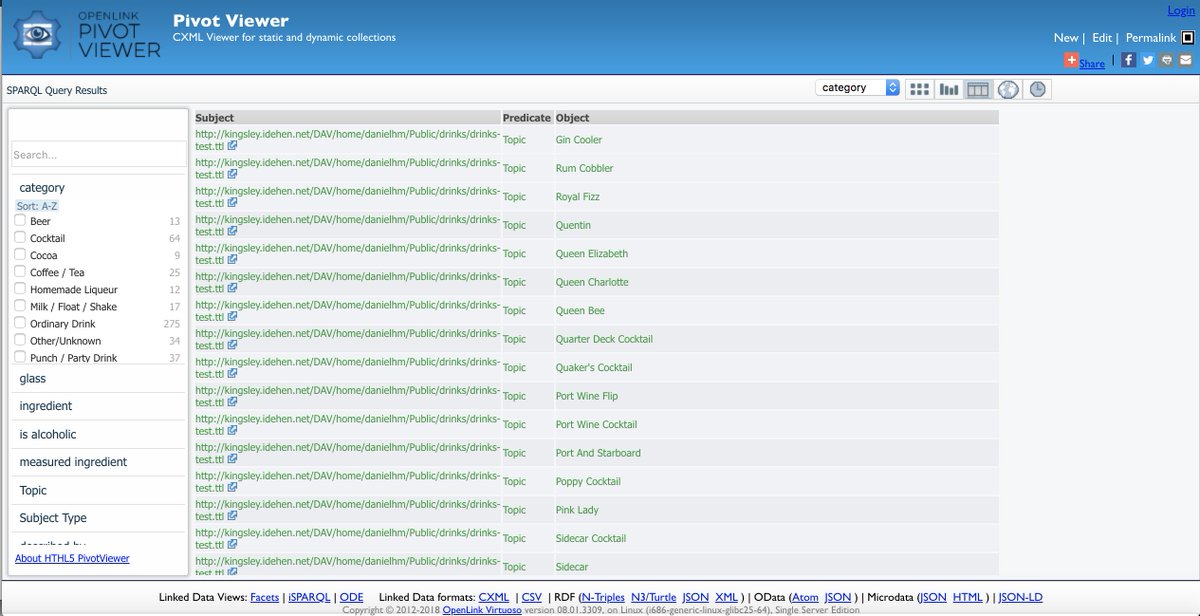
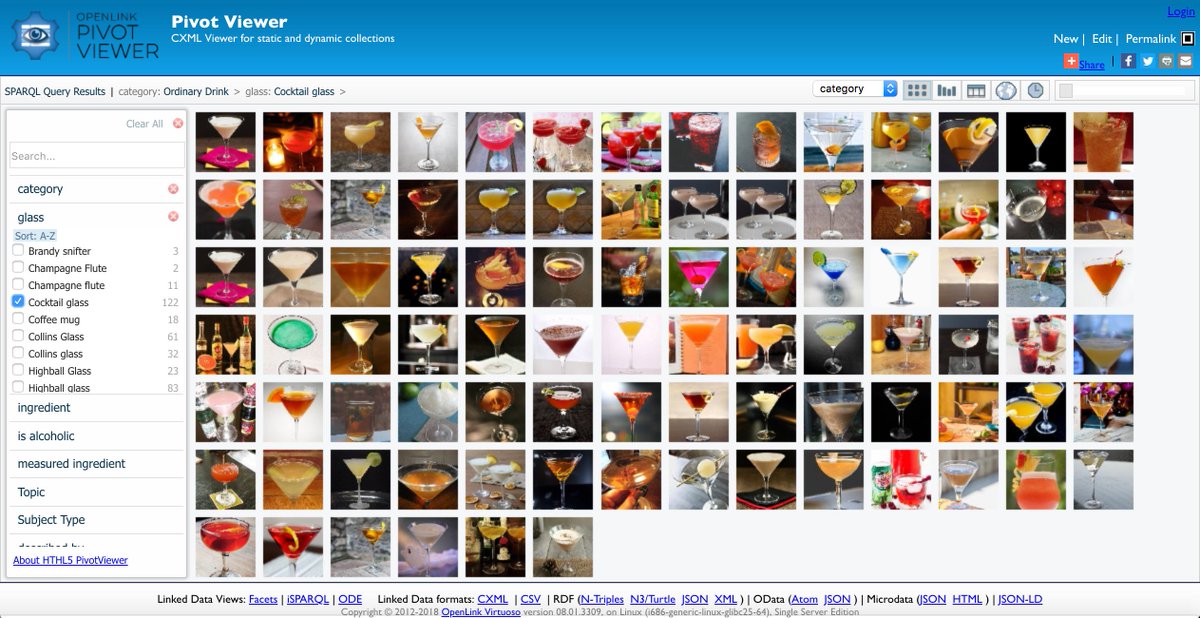
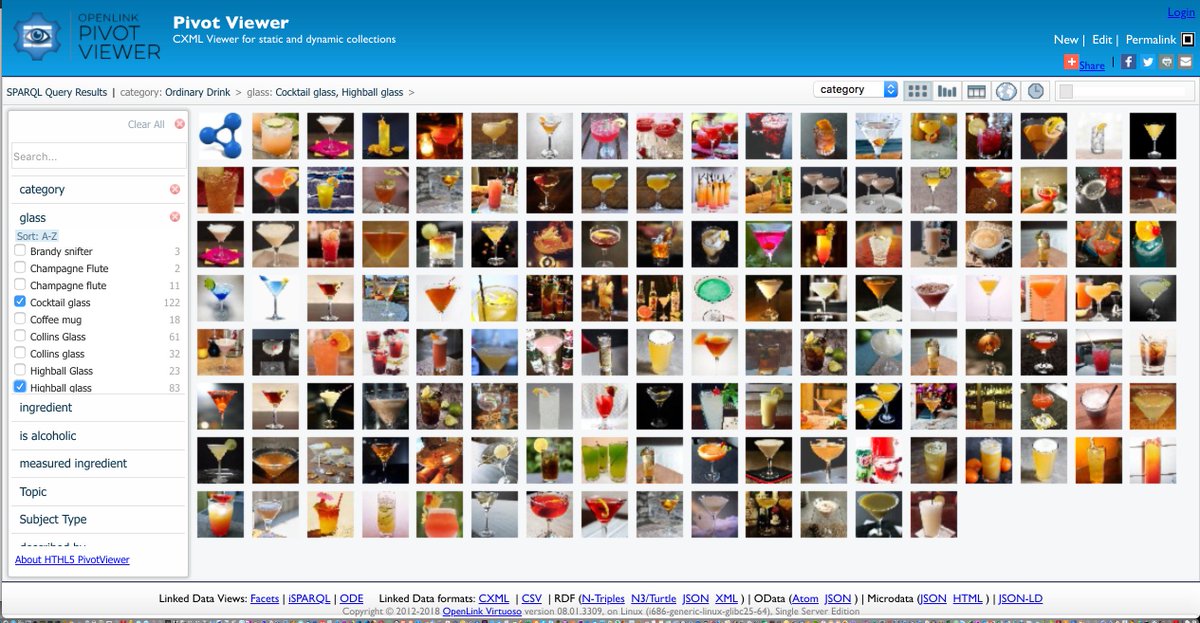
Here's the #PivotViewer report definition that exposes the #SPARQL query behind the #DataVisualization : tinyurl.com/y9o5r5lg .
#LinkedData #SemanticWeb #CIO #CDO #CMO #KnowledgeGraph #CSV #HTML5 #RDF
#LinkedData #SemanticWeb #CIO #CDO #CMO #KnowledgeGraph #CSV #HTML5 #RDF
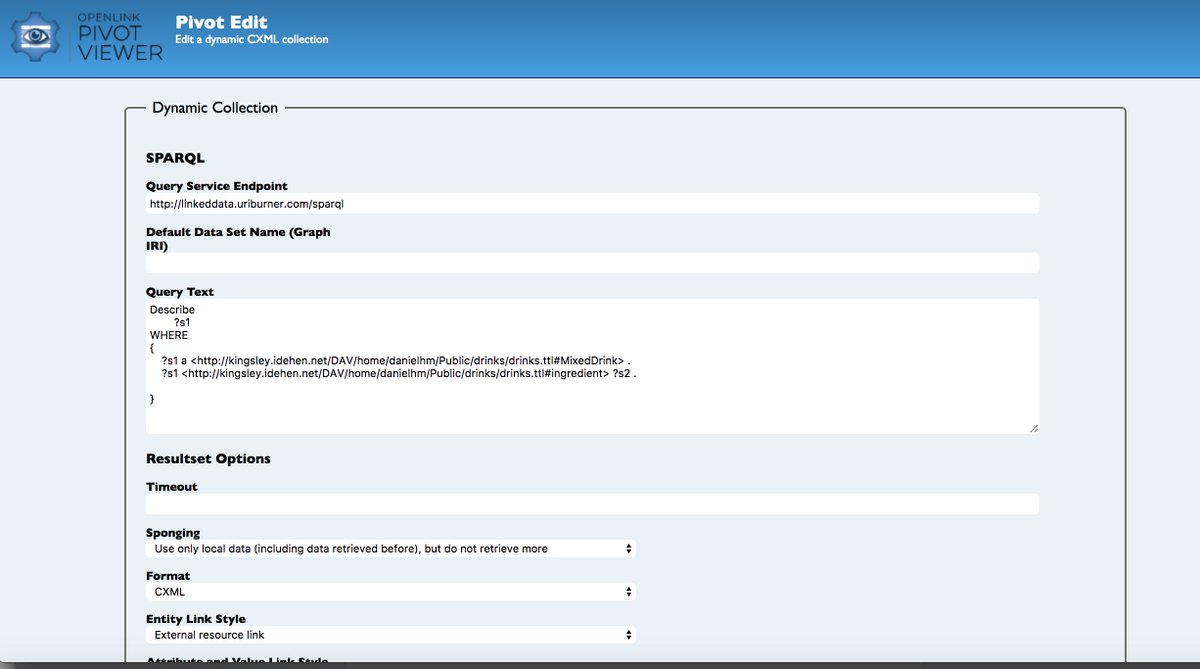
Here's a post that explains how our #HTML5 #PivotViewer functions in conjunction with #SPARQL re. powerful #DataVisualization that leverages a #SemanticWeb of #LinkedData.
Link: medium.com/virtuoso-blog/…
#GraphDatabases #DocumentDatabase #NoSQL #RDBMS
Link: medium.com/virtuoso-blog/…
#GraphDatabases #DocumentDatabase #NoSQL #RDBMS
Anyone interested in mapping the linguistic diversity of Indian states with the help of this data?
censusindia.gov.in/2011Census/Lan…
#dataviz #Datavisualization #data #india #OpenData
censusindia.gov.in/2011Census/Lan…
#dataviz #Datavisualization #data #india #OpenData
Maybe, we can compare that with economic indicators and see if there is any correlation between diversity and development.
