Discover and read the best of Twitter Threads about #dataviz
Most recents (12)

OK my @medium account got "caught in the spam filter" & has been restored so let me try this #thread again. I've been working for several months on a series of blogs explaining trolling & botting tactics used by 4chan during the election. #ContentWarning: medium.com/@erin_gallaghe…
Several months ago @elimisteve from @PursuanceProj found a series of pastebins and sent them to me. 4chan trolls studied learned graphic design software to make memes, memetic warfare and botting to troll the election. medium.com/@erin_gallaghe…
The 1st part is an 8chan thread by someone who claimed to have worked in the marketing & advertising industry. The explain various components of effective graphic design & instructions for /pol/ to “normalize” their message to blend in with the normies. medium.com/@erin_gallaghe…

Morning, #dataviz folks! Here comes a thread on the "streamgraph" chart type used in the @FinancialTimes graphic on Premier League shirt sponsors.
The research paper by @leeb & @wattenberg that introduced streamgraphs to the world is one of the best dataviz papers I've ever read
The research paper by @leeb & @wattenberg that introduced streamgraphs to the world is one of the best dataviz papers I've ever read
1/16 In November 2008, @leeb & @wattenberg published "Stacked Graphs – Geometry & Aesthetics", a wonderfully comprehensive discussion of the trade-offs between aesthetics & geometry in stacked graphs leebyron.com/streamgraph/st… 
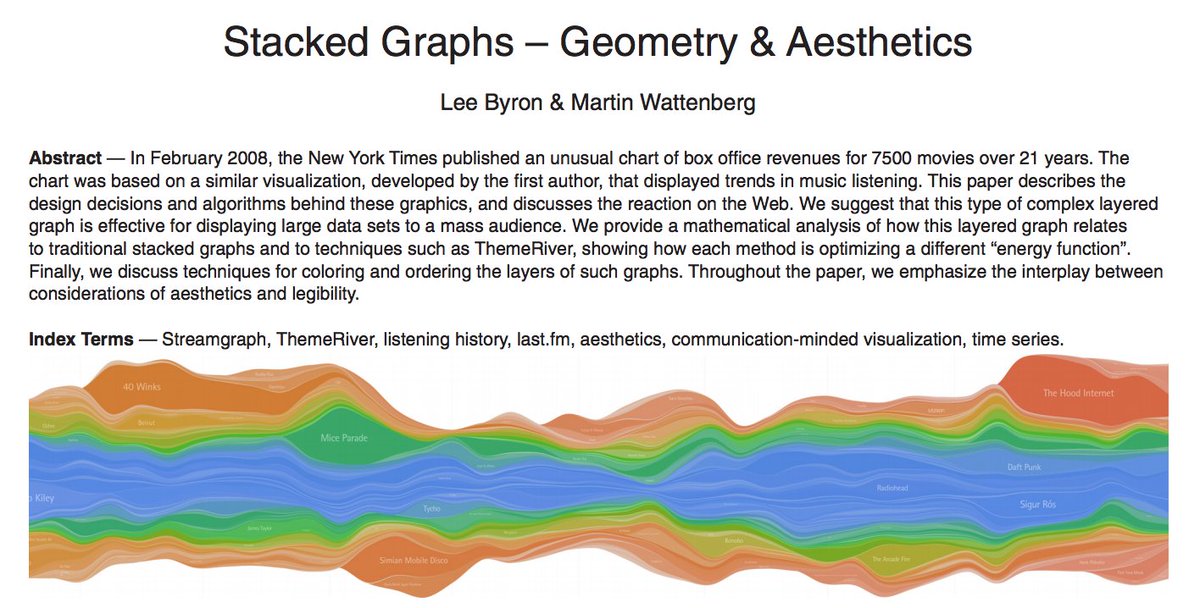
2/ I've been nerding out on key insights & other highlights. Here goes:
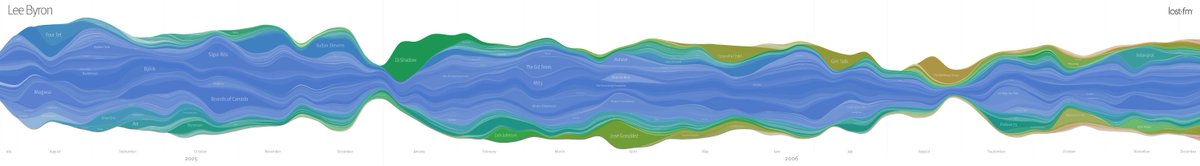
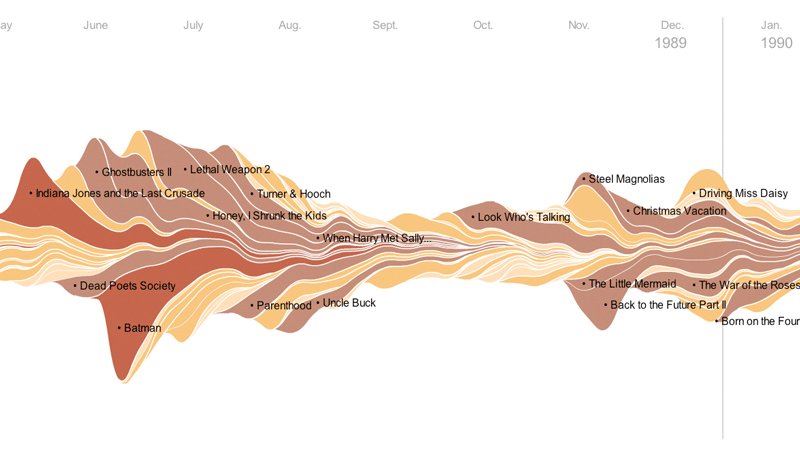
Intro: the paper followed 2 early examples of stacked, meandering graphics
- "Listening Histories": last fm listening data (pic 1)
- "The ebb and flow of movies" by @nytgraphics on box office takings (pic 2)
Intro: the paper followed 2 early examples of stacked, meandering graphics
- "Listening Histories": last fm listening data (pic 1)
- "The ebb and flow of movies" by @nytgraphics on box office takings (pic 2)
I've been working on two big projects for several months, one is finally finished tonight. #QAnon network visualizations: medium.com/@erin_gallaghe…
#QAnon trends appear to be connected to Twitter rooms, high-volume accounts and a conservative political marketing firm called AppSame.
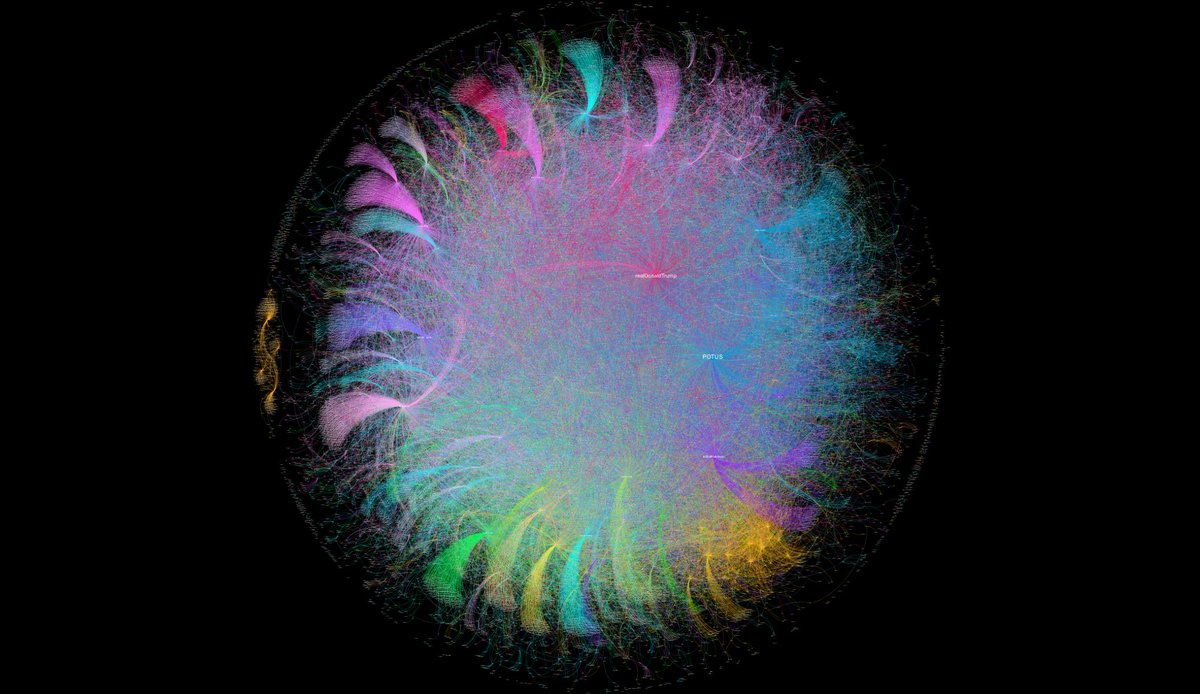
This is a user-to-user @gephi graph of 51,437 #QAnon tweets from May 3 to May 11 medium.com/@erin_gallaghe… #dataviz
This is a user-to-user @gephi graph of 51,437 #QAnon tweets from May 3 to May 11 medium.com/@erin_gallaghe… #dataviz

I constantly find high-volume accounts in certain hashtags and they are present in #QAnon networks. These high-volume accounts are hubs in Twitter networks. Here’s what some of the high-volume hubs look like in 8 days of #QAnon tweets from May 3 to May 11 medium.com/@erin_gallaghe…


So it’s a Saturday afternoon, it’s 20+ degrees outside – you know what you should do?
That’s right, read a thread about GOVERNMENT ORGANOGRAMS, a year on from our @instituteforgov #IfGhackday #opendata
That’s right, read a thread about GOVERNMENT ORGANOGRAMS, a year on from our @instituteforgov #IfGhackday #opendata
Organograms aren’t most obvious data thing to get pulses racing. Hardly AI, blockchain (#buzzword), Citymapper etc.
Part of Cameron’s May 2010 pledges (bit.ly/2LXhdqE) to open up data, they include names, salaries, professions, jobs of civil servants & units w/in depts
Part of Cameron’s May 2010 pledges (bit.ly/2LXhdqE) to open up data, they include names, salaries, professions, jobs of civil servants & units w/in depts

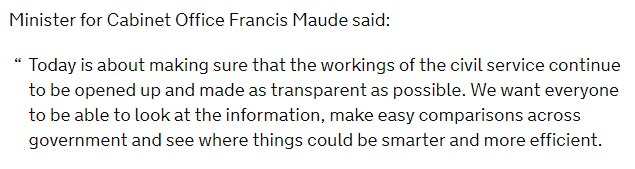
Maude called them ‘the most comprehensive organisation charts of the UK civil service ever released online’ bit.ly/2uVd28k. Not the flashiest or sexiest datasets, but mgmt info vital both for effectiveness (understanding your workforce) and accountability.
But…
But…

Anyone interested in mapping the linguistic diversity of Indian states with the help of this data?
censusindia.gov.in/2011Census/Lan…
#dataviz #Datavisualization #data #india #OpenData
censusindia.gov.in/2011Census/Lan…
#dataviz #Datavisualization #data #india #OpenData
Maybe, we can compare that with economic indicators and see if there is any correlation between diversity and development.

⬇️ Thread of thoughts on this topic ⬇️
I've taught #D3js to nearly 300 faculty, staff, and students at primarily the grad/PhD level across various workshops and bootcamps.
Some key reasons behind why D3 is hard, I'll outline below (in case anyone is learning or curious)
I've taught #D3js to nearly 300 faculty, staff, and students at primarily the grad/PhD level across various workshops and bootcamps.
Some key reasons behind why D3 is hard, I'll outline below (in case anyone is learning or curious)
While you DO need to understand empathy, design, color perception, visual cognition, story-telling, geometric thinking, graphical conventions, basic statistics, data structures, linear/spatial algebra, and trigonometry to do VISUALIZATION well, D3 makes all of this *EVEN HARDER*


Why? Because the CORE of D3 is in its name: 'Data Driven Documents.' Data-driven is one thing, but the 'Documents' part refers to the DOM, which is a broad term referring to the *stuff* that makes up the web:
HTML
CSS
SVG/XML
Canvas
JavaScript
& more - all at once
HTML
CSS
SVG/XML
Canvas
JavaScript
& more - all at once


Now comes the hard part of being an academic #opensource developer moving into industry. 😢 I need volunteers to take over some of my #rstats packages. I'm hoping to retain some but also want to pass on a few.
If you're interested, please reach out on Github about any of...
If you're interested, please reach out on Github about any of...
{csvy} is a package for reading and writing metadata-enhanced CSV files that include a YAML header.
The format: csvy.org
The package: github.com/leeper/csvy (on CRAN but needs some updates to match the current csvy specification).
The format: csvy.org
The package: github.com/leeper/csvy (on CRAN but needs some updates to match the current csvy specification).
{colourlovers} is an API client for colourlovers.com
The package: cran.r-project.org/web/packages/c… (on CRAN but could use an XML -> xml2 conversion and a refresh to make sure it's still up to date).
The package: cran.r-project.org/web/packages/c… (on CRAN but could use an XML -> xml2 conversion and a refresh to make sure it's still up to date).

Infographics work. I clicked. My first response: Catchy title but the piece provides zero basis for the statement. Data-driven safety improvements are essential--so where's the data? This could have been so much more. #RoadSafety #visionzero
Dug a bit. Googled law firm credited on map. Got thedrive.com/sheetmetal/144… telling me it's @NHTSA "accident" (sic) data for "automobiles/pedestrians". Where are bicycles/motorcycles? More Google. #CrashNotAccident #RoadSafety #VisionZero

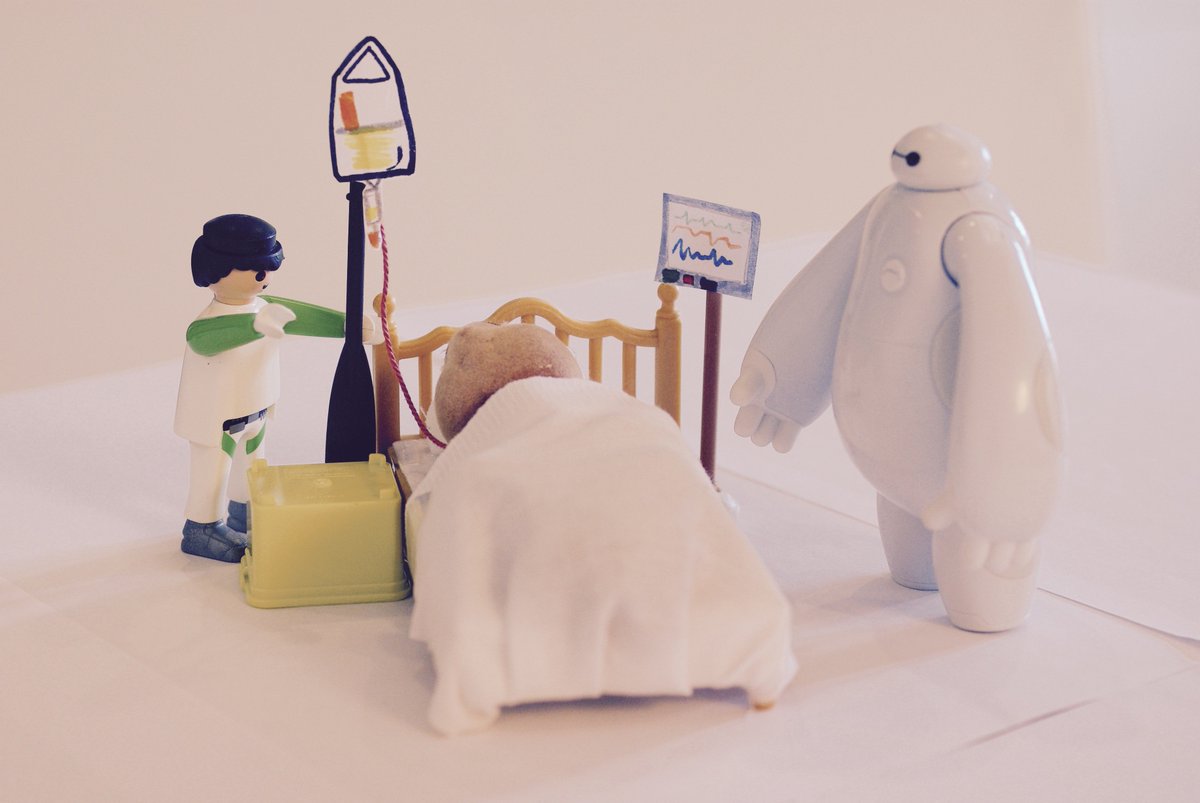
A J-14 du #hackinghealth, quels défi de #santé allez-vous relever ? Passage en revue de notre sparkboard 2017 :
Familien - comment mieux accompagner les familles lors d'une #hospitalisation ? hhlyon2017.sparkboard.com/project/59ba78…

Un outil numérique serait-il pertinent pour maintenir le lien entre enfant et patient même si les visites sont impossibles ou rares ?


Thread: Puerto Rico & U.S. Virgin Islands.
#Hurricane #Irma #Maria #PuertoRico #PuertoRicoSeLevanta #PuertoRicoStrong #USVirginIslands
#Hurricane #Irma #Maria #PuertoRico #PuertoRicoSeLevanta #PuertoRicoStrong #USVirginIslands

22.9.2017: <1/2 of mainland Americans know Puerto Ricans have U.S. citizenship. #Hurricane #PuertoRicoSeLevanta huffingtonpost.com/entry/american…
12.9.2017: "It is American land. Has been for 100 years." #Hurricane #USVirginIslands #Maria #Irma
nyti.ms/2xXYIe8
nyti.ms/2xXYIe8
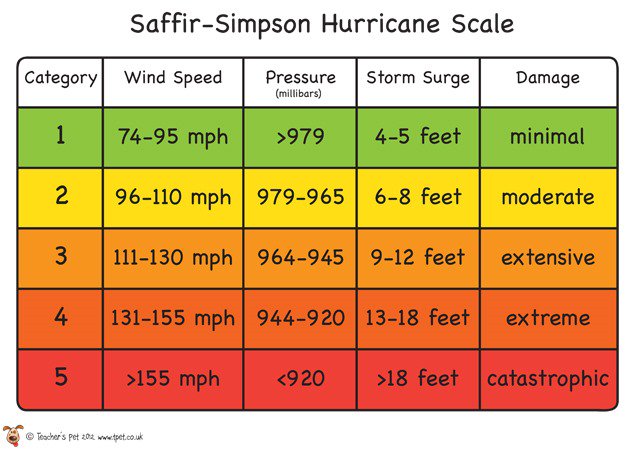
#Hurricane #Irma thread. Irma is category 5 - highest # on Saffir–Simpson hurricane wind scale.
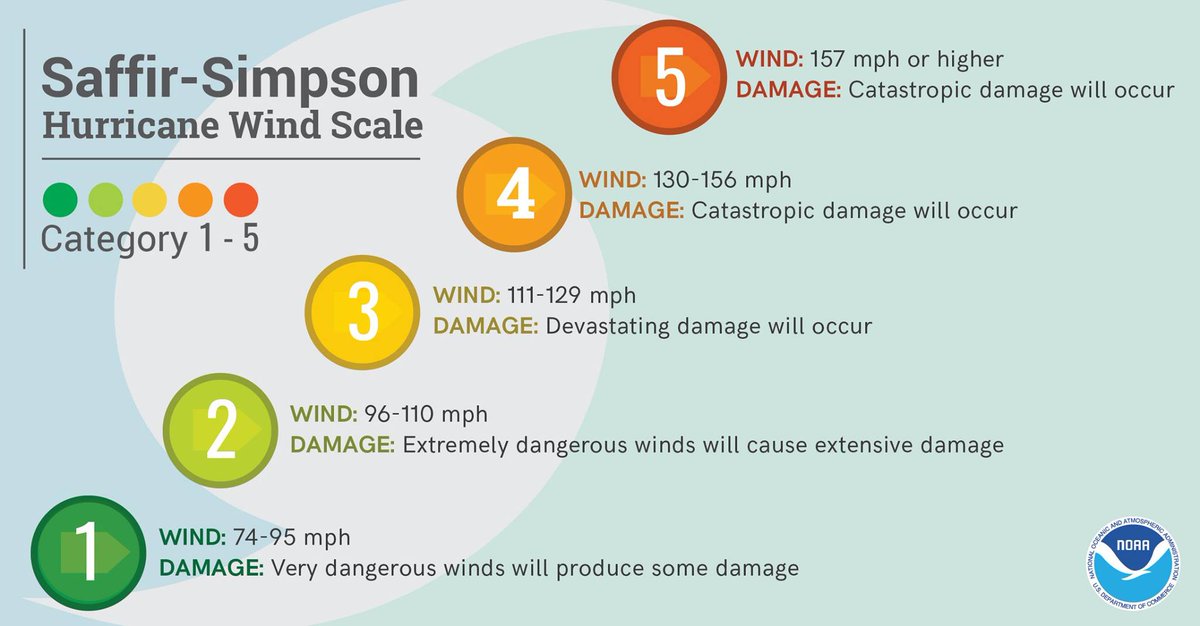

#Hurricane #Irma expected to first hit landfall in Anguilla / Leeward Islands. cnn.com/2017/09/05/us/…

What. The. Fuck.
Someone, please explain this to us ASAP cuz we're very very very lost.
Someone, please explain this to us ASAP cuz we're very very very lost.
C'mon
A pie chart of wood swatches
A pie chart of wood swatches
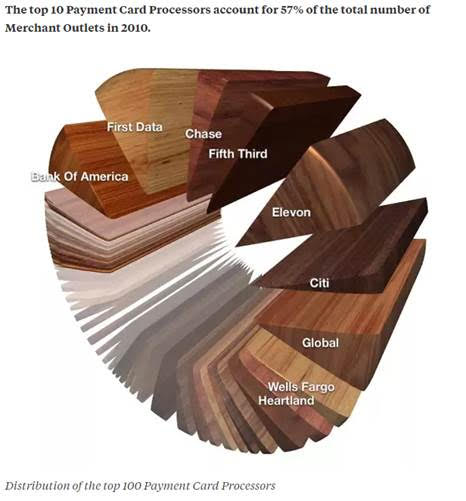
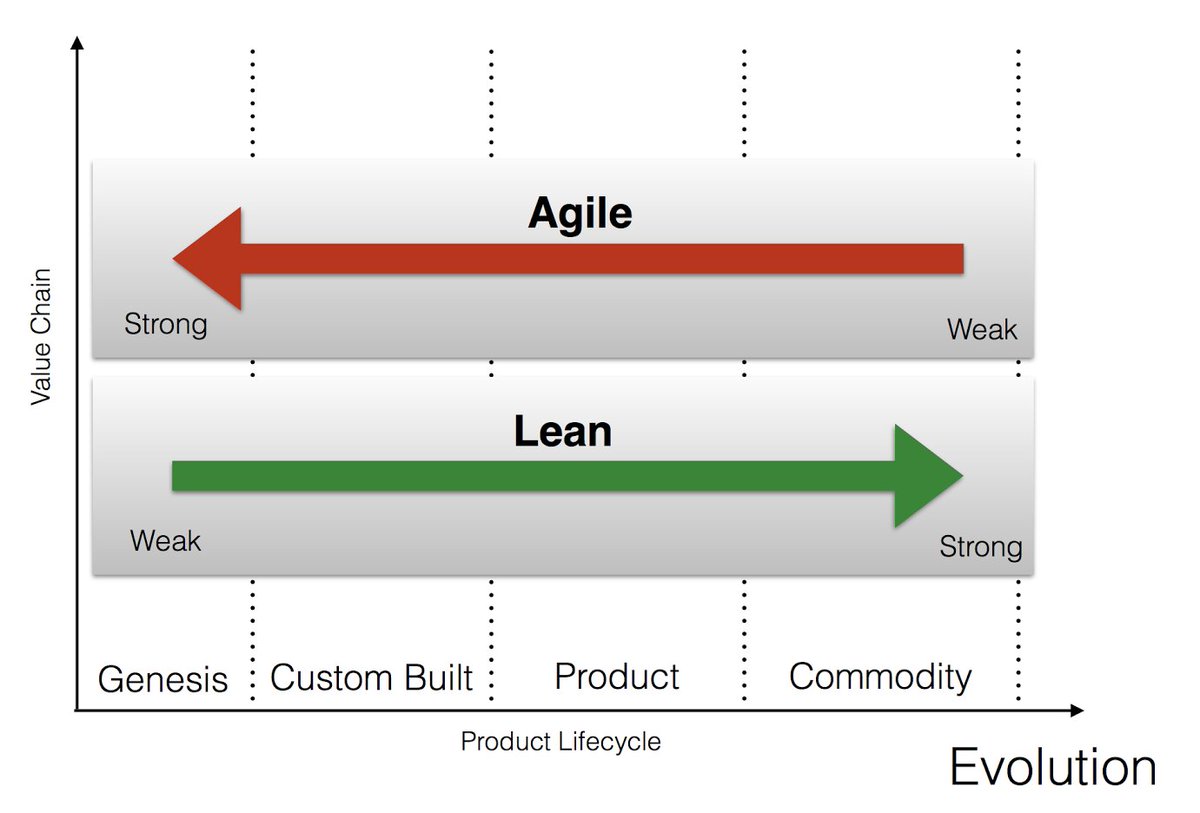
Can someone explain this framework?